Unlock a world of possibilities! Login now and discover the exclusive benefits awaiting you.
- Qlik Community
- :
- All Forums
- :
- QlikView App Dev
- :
- Suppress identical dimension values in straight ta...
- Subscribe to RSS Feed
- Mark Topic as New
- Mark Topic as Read
- Float this Topic for Current User
- Bookmark
- Subscribe
- Mute
- Printer Friendly Page
- Mark as New
- Bookmark
- Subscribe
- Mute
- Subscribe to RSS Feed
- Permalink
- Report Inappropriate Content
Suppress identical dimension values in straight table
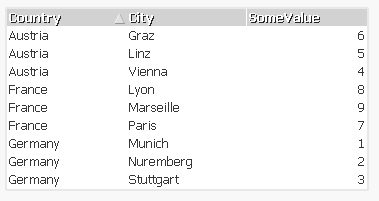
For layout reasons I would like to suppress identical dimension values in a straight table if they are shown one below the other.
As an example like in the table below the country names should only appear in the rows of their first occurence (1st, 4th, 7th).

- « Previous Replies
-
- 1
- 2
- Next Replies »
- Mark as New
- Bookmark
- Subscribe
- Mute
- Subscribe to RSS Feed
- Permalink
- Report Inappropriate Content
Use a pivot table to get this effect easily.
Or if you need a straight table, open the chart properties -> dimensions -> expand the Country dimension and edit the expression for the 'text color'
to conditionally show a transparent color use the argb() function with '0' as the first parameter:
EX:
=if( RowNo() <> 1, argb(0,125,125,125))
- Mark as New
- Bookmark
- Subscribe
- Mute
- Subscribe to RSS Feed
- Permalink
- Report Inappropriate Content
Try Using a Pivot Chart instead
- Mark as New
- Bookmark
- Subscribe
- Mute
- Subscribe to RSS Feed
- Permalink
- Report Inappropriate Content
There are advantages in using a straight table that you might not want to lose.
try changing the color to white if the above(dimension field)=dimension field
Just a trick ![]()
- Mark as New
- Bookmark
- Subscribe
- Mute
- Subscribe to RSS Feed
- Permalink
- Report Inappropriate Content
Thanks to all, the tricks with the "rowno()" as well as the "above()" work fine and do suppress the correct rows.
Unfortunately, however, as soon as I incorporate those functions QV will somehow ignore my second sort priority. The objective is to display all records within a group (i.e. the rows with identical dimensional values) in a descending order based on a (rather complex) calculated measure.
- Mark as New
- Bookmark
- Subscribe
- Mute
- Subscribe to RSS Feed
- Permalink
- Report Inappropriate Content
this reminds me a little of a bug we had in some previous version.
what version are you using?
- Mark as New
- Bookmark
- Subscribe
- Mute
- Subscribe to RSS Feed
- Permalink
- Report Inappropriate Content
I am using QlikView for Windows Desktop Version 11.20.12742.0 SR10
(Free version, since I am still evaluating, downloaded about one month ago from qlik.com)
- Mark as New
- Bookmark
- Subscribe
- Mute
- Subscribe to RSS Feed
- Permalink
- Report Inappropriate Content
that is the latest one.
Can you post a sample app?
- Mark as New
- Bookmark
- Subscribe
- Mute
- Subscribe to RSS Feed
- Permalink
- Report Inappropriate Content
Pls find attached a sample app. I hope you can open it because until now I am working with the free desktop Version.
- Mark as New
- Bookmark
- Subscribe
- Mute
- Subscribe to RSS Feed
- Permalink
- Report Inappropriate Content
unfortunately it looks like the bug is still there....
even in SR10
- « Previous Replies
-
- 1
- 2
- Next Replies »