Unlock a world of possibilities! Login now and discover the exclusive benefits awaiting you.
- Qlik Community
- :
- All Forums
- :
- QlikView App Dev
- :
- Re: Help with gauge in table, please
- Subscribe to RSS Feed
- Mark Topic as New
- Mark Topic as Read
- Float this Topic for Current User
- Bookmark
- Subscribe
- Mute
- Printer Friendly Page
- Mark as New
- Bookmark
- Subscribe
- Mute
- Subscribe to RSS Feed
- Permalink
- Report Inappropriate Content
Help with gauge in table, please
Hi,
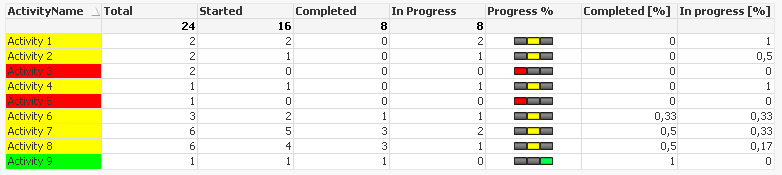
I want to make table of activities and show the progress of each group of activities.
Activities have unique ids (ActivityId) but are grouped by their name (ActivityName) and their status can be pending, started (ongoing) or completed. The status is stated by flags (flagIsStarted and flagIsCompleted), and each entry has its own line in the data, i.e. one line when it is started and one when it is completed.
I have calculated the number of total unique activities, the number of started and completed activities from the data and derived the number of activities in progress (started - completed), both in number and in percent.
My problem emerges as I try to add a gauge in the table showing the number of completed and ongoing in relation to the total number of activities in the group in different colours (green for completed, yellow for ongoing and red for not yet started). To me it seems like the numbers are added over the whole table in the graph, as I get the same values for gauges on all rows. The fact that if I select one group of activities it looks correct, but then I don't see the other ones.
I want the current progress status for each activity group.
For example, in the table below, Activity 1 should have been all yellow as both are started but none completed. Activity 3 should have been all red as none is started.

I have attached the example file.
Any ideas? 🙂
- « Previous Replies
-
- 1
- 2
- Next Replies »
- Mark as New
- Bookmark
- Subscribe
- Mute
- Subscribe to RSS Feed
- Permalink
- Report Inappropriate Content
Hi Erik,
I think I understand your problem.
You're trying to make the colours dynamic line by line and that's not how this chart works. These properties are set across the whole chart.
Richard
- Mark as New
- Bookmark
- Subscribe
- Mute
- Subscribe to RSS Feed
- Permalink
- Report Inappropriate Content
Hi Richard,
Yes, that is exactly what I want. If that is not a possible way forward, are there any other ways to achieve the same effect?
BR,
Erik
- Mark as New
- Bookmark
- Subscribe
- Mute
- Subscribe to RSS Feed
- Permalink
- Report Inappropriate Content
I think that this is what is required. You need to set the rule in the expression and then define the guage - See if you like it
Rupert
- Mark as New
- Bookmark
- Subscribe
- Mute
- Subscribe to RSS Feed
- Permalink
- Report Inappropriate Content
Thanks for your reply, Rupert, but that is not what I want to achieve.
- Mark as New
- Bookmark
- Subscribe
- Mute
- Subscribe to RSS Feed
- Permalink
- Report Inappropriate Content
How about this ....
You save a column of data by colouring the activities .....
- Mark as New
- Bookmark
- Subscribe
- Mute
- Subscribe to RSS Feed
- Permalink
- Report Inappropriate Content
Hi,
You can See attached QVW.
- Mark as New
- Bookmark
- Subscribe
- Mute
- Subscribe to RSS Feed
- Permalink
- Report Inappropriate Content
A better example:
- Mark as New
- Bookmark
- Subscribe
- Mute
- Subscribe to RSS Feed
- Permalink
- Report Inappropriate Content
Thank you, Krishnama, but I don't quite see what you mean.
- Mark as New
- Bookmark
- Subscribe
- Mute
- Subscribe to RSS Feed
- Permalink
- Report Inappropriate Content
Hi,
What you require from me. I also sent QVW . You do not keep expression in Gauge Properties. you can see attachment.
- « Previous Replies
-
- 1
- 2
- Next Replies »