Unlock a world of possibilities! Login now and discover the exclusive benefits awaiting you.
- Qlik Community
- :
- All Forums
- :
- QlikView App Dev
- :
- Re: Pie Chart visualization: Overlapping values
- Subscribe to RSS Feed
- Mark Topic as New
- Mark Topic as Read
- Float this Topic for Current User
- Bookmark
- Subscribe
- Mute
- Printer Friendly Page
- Mark as New
- Bookmark
- Subscribe
- Mute
- Subscribe to RSS Feed
- Permalink
- Report Inappropriate Content
Pie Chart visualization: Overlapping values
Hi folks,
I have a question regarding pie chart visualization:
The end user wants a pie charts which visualizes his KPI. There are some very high values and some low ones.
Normally, the pie chart is configured, that it creates a virtual dimension "others", where the low values are aggregated. If you click the "others" dimension, then you drill down to the remaining low values.
This is not acceptable for some end users, because they want to export the pie chart to PPT without any drill-down to make.
This is why I changed the minimal value setting for the pie chart to 0.001. This would be the solution, but it leads to overlapping values within the graphic:
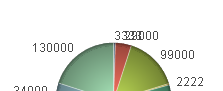
Does anyone have a solution to this problem? Is there any option, that the values at the pie chart can be visualized in a staggered way?
I have included a 'demo example' to this problem.
Any help is highly appreciated!
- « Previous Replies
-
- 1
- 2
- Next Replies »
- Mark as New
- Bookmark
- Subscribe
- Mute
- Subscribe to RSS Feed
- Permalink
- Report Inappropriate Content
new_user3 schrieb:
Hello,
I took sometime and did this. If I was you, this looks a lot better I dont know if its really useful, but Pie charts are used to show percentages rather than the actual numbers.
Thanks
ANDY
Hi Andy, thanks for the input.
This has the "others" dimension included, which I had to eliminate due to customer requirement.
- Mark as New
- Bookmark
- Subscribe
- Mute
- Subscribe to RSS Feed
- Permalink
- Report Inappropriate Content
Neetu Singh schrieb:
Hi,
Please find the attachment. it will help you out.
At expression click on(+)sign and add the expression in Pie popup and in presentation set "lower limit on slice".
As shown in attachment.
Regards
Neetu SIngh
I am afraid the end user needs the lower limit setting I used, because the graphic has to be exported to PowerPoint and used during presentations, so any mouse-over effect etc. is not the solution here. But thank you very much!
- Mark as New
- Bookmark
- Subscribe
- Mute
- Subscribe to RSS Feed
- Permalink
- Report Inappropriate Content
stephen.redmond schrieb:
Hi,
You can add some stagger using the Repeat function with some carriage returns. See attached. Note the -6 is a static value which should probably be calculated - I will leave that to you.
However, I agree with the previous comments that suggest that this is a very poor visualisation of the data - use a straight table (where you can have columns for actual amount and %) or a bar chart.
Regards,
Stephen
The staggering function is exactly what I was looking for! Thank you very much! Made my day!
- Mark as New
- Bookmark
- Subscribe
- Mute
- Subscribe to RSS Feed
- Permalink
- Report Inappropriate Content
My pie chart doesn't seem to be showing the dimension and the value, like yours.
I'm also using the dual function.
What am I missing?
- Mark as New
- Bookmark
- Subscribe
- Mute
- Subscribe to RSS Feed
- Permalink
- Report Inappropriate Content
@Beanz ..
Did you found a solution? Example of Stephen is working, but in my own dashboard not. Even tried to copy the object of Stephen, only changed the expression a little bit (different measures)
- Mark as New
- Bookmark
- Subscribe
- Mute
- Subscribe to RSS Feed
- Permalink
- Report Inappropriate Content
Hi
does this solution works for combo or two line charts also??
Thanks
Kiran Kumar
- « Previous Replies
-
- 1
- 2
- Next Replies »