Unlock a world of possibilities! Login now and discover the exclusive benefits awaiting you.
- Qlik Community
- :
- All Forums
- :
- QlikView App Dev
- :
- Re: categorize the values
- Subscribe to RSS Feed
- Mark Topic as New
- Mark Topic as Read
- Float this Topic for Current User
- Bookmark
- Subscribe
- Mute
- Printer Friendly Page
- Mark as New
- Bookmark
- Subscribe
- Mute
- Subscribe to RSS Feed
- Permalink
- Report Inappropriate Content
categorize the values
hello all,
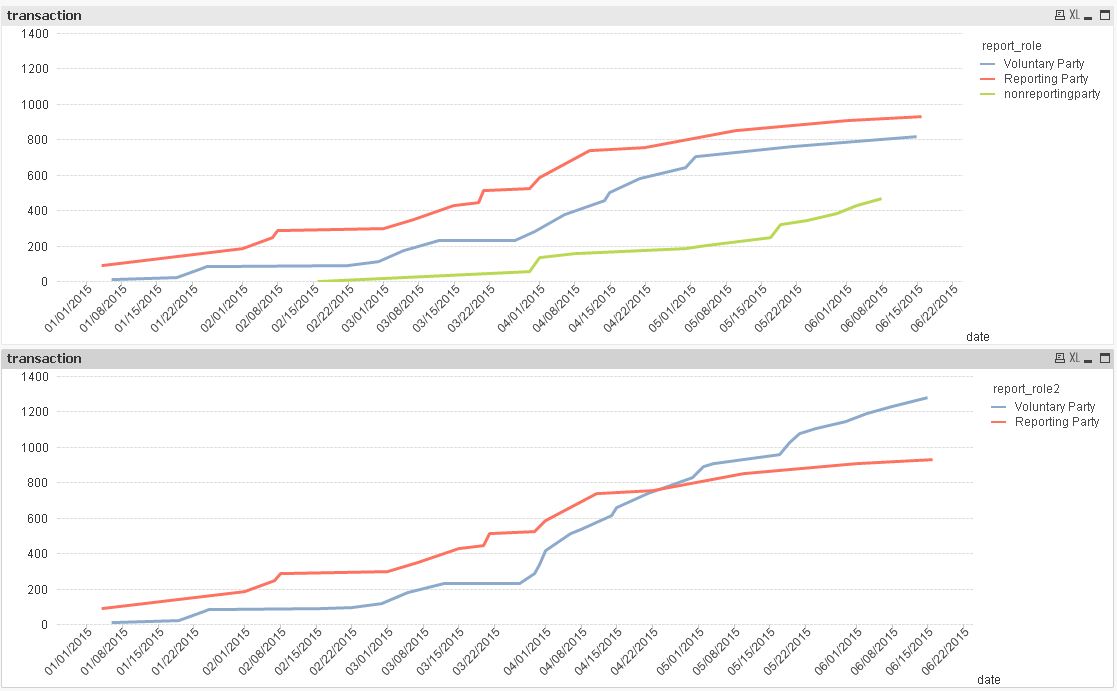
i have a to do a graph to dsiplay the values of the field : report_role. the field has three values :Voluntary Party, Reporting Party, nonreportingparty. I have to do just 2 categories for the values : Voluntary Party (Voluntary Party + nonreportingparty) and Reporting Party.
can someone give me the main steps to di this in the designer ?
thnaks in advance
- Mark as New
- Bookmark
- Subscribe
- Mute
- Subscribe to RSS Feed
- Permalink
- Report Inappropriate Content
Hi,
can you post a QVW file with test data?
Regards.
- Mark as New
- Bookmark
- Subscribe
- Mute
- Subscribe to RSS Feed
- Permalink
- Report Inappropriate Content
- Mark as New
- Bookmark
- Subscribe
- Mute
- Subscribe to RSS Feed
- Permalink
- Report Inappropriate Content
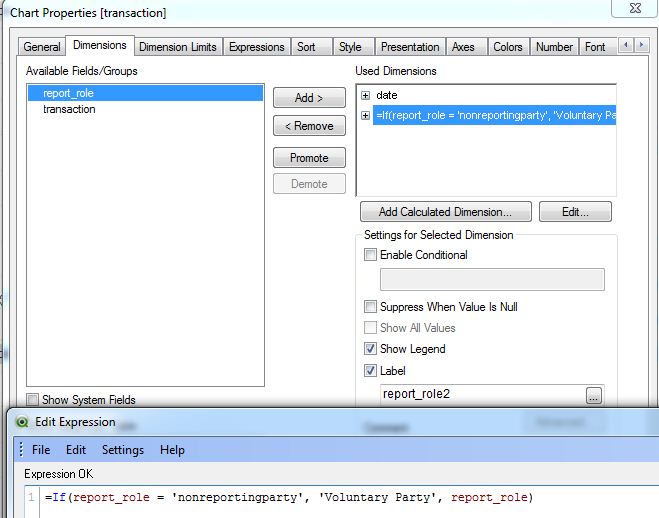
Use calculated dimension as
If(Match(report_role,'Voluntary Party','nonreportingparty') , 'Voluntary Party', Reporting Party)
- Mark as New
- Bookmark
- Subscribe
- Mute
- Subscribe to RSS Feed
- Permalink
- Report Inappropriate Content
Create two set analysis expressions, one for each category. If your current expression is sum(TransactionAmount) then create two expressions like these:
Voluntary Party: sum({<report_role={'Voluntary Party','nonreportingparty'}>}TransactionAmount)
Reporting Party: sum({<report_role={'Reporting Party'}>}TransactionAmount)
Make sure to use the exact case sensitive field names and values of your document. Don't blindly copy my example expressions.
talk is cheap, supply exceeds demand
- Mark as New
- Bookmark
- Subscribe
- Mute
- Subscribe to RSS Feed
- Permalink
- Report Inappropriate Content
If(Match(report_role,'Voluntary Party','nonreportingparty') , 'Voluntary Party', 'Reporting Party')
- Mark as New
- Bookmark
- Subscribe
- Mute
- Subscribe to RSS Feed
- Permalink
- Report Inappropriate Content
If(report_role = 'nonreportingparty', 'Voluntary Party', report_role)
- Mark as New
- Bookmark
- Subscribe
- Mute
- Subscribe to RSS Feed
- Permalink
- Report Inappropriate Content
Hi
Please see below my comments and accordingly change the syntax and your case sensitive fields.
sum(TransactionAmount) then create two expressions like these:
Voluntary Party: sum({<report_role={'Voluntary Party','nonreportingparty'}>}TransactionAmount)
Reporting Party: sum({<report_role={'Reporting Party'}>}TransactionAmount)
Thanks
- Mark as New
- Bookmark
- Subscribe
- Mute
- Subscribe to RSS Feed
- Permalink
- Report Inappropriate Content
one example:
hope this helps
regards
Marco