Unlock a world of possibilities! Login now and discover the exclusive benefits awaiting you.

- Qlik Community
- :
- Forums
- :
- Analytics & AI
- :
- Products & Topics
- :
- Visualization and Usability
- :
- Re: Bell curve
- Subscribe to RSS Feed
- Mark Topic as New
- Mark Topic as Read
- Float this Topic for Current User
- Bookmark
- Subscribe
- Mute
- Printer Friendly Page

- Mark as New
- Bookmark
- Subscribe
- Mute
- Subscribe to RSS Feed
- Permalink
- Report Inappropriate Content
Bell curve
Hi all,
hic
I need to draw a bell curve for the below data.
Please help me to do it.
I used the below link to prepare:
I have done to some extent but i am not sure that it is correct. please do check and clarify.
I have attached sample data and .qvf file.
Regards,
Pramod
Accepted Solutions

.png "Former Employee") hic
hic
- Mark as New
- Bookmark
- Subscribe
- Mute
- Subscribe to RSS Feed
- Permalink
- Report Inappropriate Content
If you use a calculated dimension for a histogram, everything will become very complicated... Hence, you should define your dimension field already in the script. Then it is straightforward.
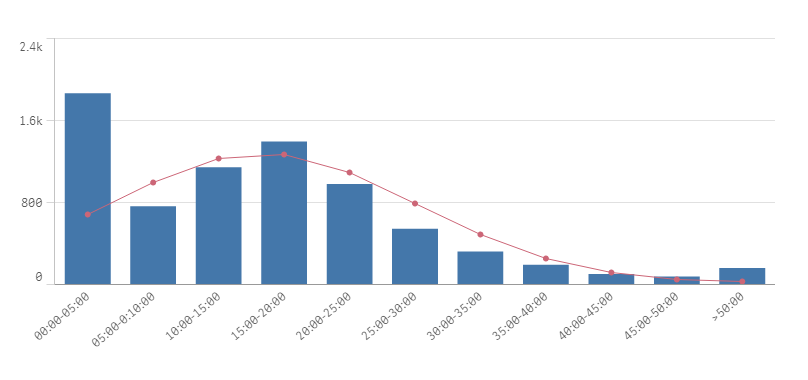
But I am not sure the data fits a normal distribution...
HIC
hic
- Mark as New
- Bookmark
- Subscribe
- Mute
- Subscribe to RSS Feed
- Permalink
- Report Inappropriate Content
If you use a calculated dimension for a histogram, everything will become very complicated... Hence, you should define your dimension field already in the script. Then it is straightforward.
But I am not sure the data fits a normal distribution...
HIC
- Mark as New
- Bookmark
- Subscribe
- Mute
- Subscribe to RSS Feed
- Permalink
- Report Inappropriate Content
Thanks a lot henric cronstrom,
Now it's working fine.
Regards,
pramod
- Mark as New
- Bookmark
- Subscribe
- Mute
- Subscribe to RSS Feed
- Permalink
- Report Inappropriate Content
Hi Henric,
hic
1) your reply was most helpful. But one issue. I was using below script to load the data for 5 minutes time interval:
LOAD *,
If(total_time_taken<='00:05:00' ,Dual('00:00-05:00',0),
If(total_time_taken>='00:05:00' and total_time_taken<='00:10:00' ,Dual('05:00-0:10:00',1),
If(total_time_taken>='00:10:00' and total_time_taken<='00:15:00' ,Dual('10:00-15:00',2),
If(total_time_taken>='00:15:00' and total_time_taken<='00:20:00' ,Dual('15:00-20:00',3),
If(total_time_taken>='00:20:00' and total_time_taken<='00:25:00' ,Dual('20:00-25:00',4),
If(total_time_taken>='00:25:00' and total_time_taken<='00:30:00' ,Dual('25:00-30:00',5),
If(total_time_taken>='00:30:00' and total_time_taken<='00:35:00' ,Dual('30:00-35:00',6),
If(total_time_taken>='00:35:00' and total_time_taken<='00:40:00' ,Dual('35:00-40:00',7),
If(total_time_taken>='00:40:00' and total_time_taken<='00:45:00' ,Dual('40:00-45:00',8),
If(total_time_taken>='00:45:00' and total_time_taken<='00:50:00' ,Dual('45:00-50:00',9),
If(total_time_taken>'00:50:00',Dual('>50:00',10)
))))))))))) as time_interval;
but now i need show the data for every 1 minute interval , so i need to hard code like below,
If(total_time_taken>='00:01:00' and total_time_taken<='00:02:00' ,Dual('01:00-02:00',1),
If(total_time_taken>='00:02:00' and total_time_taken<='00:03:00' ,Dual('02:00-03:00',2),
Is their any other way to display without hard coding ?
2) I need to display the data values of bar in combo chart. how can i done this.
3) I need to disable the selection so, i have using {1}, but how this can be used for below expression: which should be applied for whole expression:
only(Normdist(round(total_time_taken,avgTime),Avg({1<subject_id={'2'},subject_status={'passed','completed'}>}total total_time_taken),
Stdev({1<subject_id={'2'},subject_status={'passed','completed'}>}total total_time_taken),1))
*avgTime*Count({1<subject_id={'2'},subject_status={'passed','completed'}>}total_time_taken)
Thanks,
Pramod

 jonathandienst
- Mark as New
- Bookmark
- Subscribe
- Mute
- Subscribe to RSS Feed
- Permalink
- Report Inappropriate Content
This discussion is closed - I suggest that you start a new discussion for this question.