Unlock a world of possibilities! Login now and discover the exclusive benefits awaiting you.
- Qlik Community
- :
- All Forums
- :
- QlikView App Dev
- :
- Re: Scale in X axis showing dash for no value
- Subscribe to RSS Feed
- Mark Topic as New
- Mark Topic as Read
- Float this Topic for Current User
- Bookmark
- Subscribe
- Mute
- Printer Friendly Page
- Mark as New
- Bookmark
- Subscribe
- Mute
- Subscribe to RSS Feed
- Permalink
- Report Inappropriate Content
Scale in X axis showing dash for no value
Hello
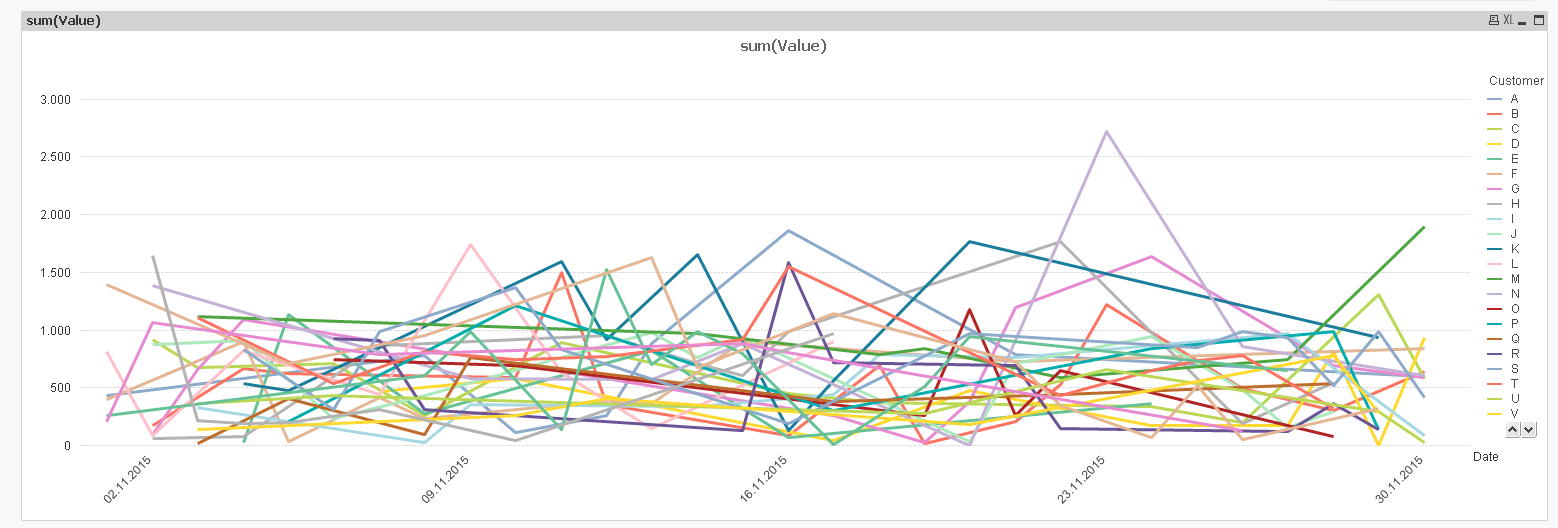
I have a chart. I not have data beyond 3 weeks. However I see dash symbol in scale on x axis. Attaching a screenshot. Any ideas hwo to remove?
Thanks
DV
- « Previous Replies
-
- 1
- 2
- Next Replies »
- Mark as New
- Bookmark
- Subscribe
- Mute
- Subscribe to RSS Feed
- Permalink
- Report Inappropriate Content
Add two dimensions
1) Week Start date
2) The actual Date
Then go to presentation tab and uncheck 'Show Legend' for the second dimension (which is the actual date). This way you will have weekstart date on x-axis and there will be multiple data points if there is more than one data point in that week.
Thanks
- Mark as New
- Bookmark
- Subscribe
- Mute
- Subscribe to RSS Feed
- Permalink
- Report Inappropriate Content
Hi Padmaja,
Looks like you are trying to help me with an answer but I am not able to view the answer? Not sure if it is moderated out for some reason?
Thanks
DV
- Mark as New
- Bookmark
- Subscribe
- Mute
- Subscribe to RSS Feed
- Permalink
- Report Inappropriate Content
I assume you have changed the color attribute expression for an expression, not for the dimension.
But I forgot that changing the text color of a line chart dimension has some issues:
Changing Dimension Colour and Font in Bar chart (Selectively)
I played a little with an additional expression and value on axis option, but this does not seem to work nicely, especially with multiple lines.
I also played around with my other suggestion, the continuous axis. Unfortunately, I wasn't able to exactely control the labels.
Then I came back to a non-contiguous axis, but using a calculated dimension instead of the dimension attributes:
=if(Date=Weekstart(Date), Date(Date), Dual('',Date))
On Weekstart, output the date values, on other weekdays, use an empty string text representation.
See attached a demo.
edit: Here is a screenshot of how it looks

- Mark as New
- Bookmark
- Subscribe
- Mute
- Subscribe to RSS Feed
- Permalink
- Report Inappropriate Content
Hi padmaja
i tried as you suggested but the x axis legend went off. Attached are two screenshots. Anything I need to do in expressions?
Thanks
DV
- Mark as New
- Bookmark
- Subscribe
- Mute
- Subscribe to RSS Feed
- Permalink
- Report Inappropriate Content
Click on the dimension that you don't want to display and disable that one? as you can see below? send me your file and I can see what the issue is?
Thanks,
- Mark as New
- Bookmark
- Subscribe
- Mute
- Subscribe to RSS Feed
- Permalink
- Report Inappropriate Content
This shows data points on week boundaries only. I still dont see week starts on scale and data points by date. So between 10/19 and 9/21 I should see data points at day granularity..
- Mark as New
- Bookmark
- Subscribe
- Mute
- Subscribe to RSS Feed
- Permalink
- Report Inappropriate Content
What about the solution I've posted some weeks ago here to this thread?
- Mark as New
- Bookmark
- Subscribe
- Mute
- Subscribe to RSS Feed
- Permalink
- Report Inappropriate Content
Hi swuehl,
It works as long as you have date_due falling on week start, if no date_due is on week start the x axis scale is completely blanked out which is not correct. I always want to see week starts regardless of date_due coinciding with it or not.
Thanks
DV
- « Previous Replies
-
- 1
- 2
- Next Replies »