Unlock a world of possibilities! Login now and discover the exclusive benefits awaiting you.
- Qlik Community
- :
- All Forums
- :
- QlikView App Dev
- :
- Re: How to include a constant value in pivot table
- Subscribe to RSS Feed
- Mark Topic as New
- Mark Topic as Read
- Float this Topic for Current User
- Bookmark
- Subscribe
- Mute
- Printer Friendly Page
- Mark as New
- Bookmark
- Subscribe
- Mute
- Subscribe to RSS Feed
- Permalink
- Report Inappropriate Content
How to include a constant value in pivot table
Hello,
I have a two-dimensional pivot table with a regional dimension (Key: SKEY_R, Labels: TEXT_R) and a time dimension (KEY: SKEY_Z). The fact F1 is summed up.
As a second fact I'd like to have the value of the top of the regional structure (SKEY_R = BRD) relating the respective month. That means that the zeroes in the picture below should have the values 174810 and 172408 respectively.
Any ideas?
Many thanks in advance
Frank Backes
- « Previous Replies
-
- 1
- 2
- Next Replies »
Accepted Solutions
- Mark as New
- Bookmark
- Subscribe
- Mute
- Subscribe to RSS Feed
- Permalink
- Report Inappropriate Content
I can recommend all articles and tech docs of the Qlik design blog, especially the ones written by Henric:
The other authors are of course also worth reading.
Don't forget to read the in-depth tech docs referenced in the design blog posts.
Marcus has collected some books about Qlik:
I can highly recommend QV11 for developers, Mastering QV and QV your business.
There are also now a lot of QV related blogs:
Regards,
Stefan
- Mark as New
- Bookmark
- Subscribe
- Mute
- Subscribe to RSS Feed
- Permalink
- Report Inappropriate Content
Would be helpful if you state the expressions you are using, too.
You can look into the TOTAL qualifier with field lists, so if your only expression is Sum(F1), try something like
=If(SKEY_R='BRD', Sum(TOTAL<SKEY_Z> F1), Sum(F1) )
- Mark as New
- Bookmark
- Subscribe
- Mute
- Subscribe to RSS Feed
- Permalink
- Report Inappropriate Content
Many thanks for the quick answer!
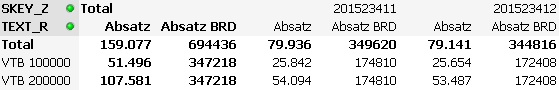
I have attached another screenshot to make my point more clear:
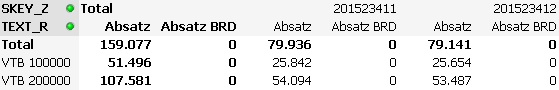
Here we can see the numbers for two regions VTB 1000000 and VTB 200000 for two time keys 201523411 and 201523412.
There are actually two more regions, which are not selected in the respective filter. The top of the regional hierarchy is 'BRD', which consists of the four regions. The values (Field F1, Label 'Absatz') for the regions are summed up from their children: areas, subterritories and segments.
I the column 'Absatz BRD' I always want to see the value for 'BRD' dependent on the respective time key. These would be 174.810 for 201523411 and 172.408 for 201523412.
Expression for 'Absatz': sum(F1)
Expression for 'Absatz BRD': sum({<TEXT_R={'BRD'}>} F1)
The latter does not work. I guess that's because 'BRD' is not the actual value of TEXT_R in the actual line.
- Mark as New
- Bookmark
- Subscribe
- Mute
- Subscribe to RSS Feed
- Permalink
- Report Inappropriate Content
Try something like
Sum( Aggr( sum({<TEXT_R= >} TOTAL<SKEY_Z> F1), TEXT_R, SKEY_Z))
- Mark as New
- Bookmark
- Subscribe
- Mute
- Subscribe to RSS Feed
- Permalink
- Report Inappropriate Content
Many thanks again! 🙂
Unfortunately that expression doesn't deliver the right results:
Isn't it possible to calculate the sum of F1 where one dimension member is fixed (TEXT_R = 'BRD') and the others (time) are changing according to their position in the grid? Isn't that a common requirement? E.g. to calculate percentages relating to a special member of a dimension or to calculate market shares?
Since I'm totally new to QlikView I think I first have to learn more about expressions. I'm not able to fully interpret your suggestions yet. 😉
- Mark as New
- Bookmark
- Subscribe
- Mute
- Subscribe to RSS Feed
- Permalink
- Report Inappropriate Content
Could you post a small sample QVW? Or an Excel with a sample table of your field values?
It seems I don't really understand your setting. Is 'BRD' a value in field TEXT_R?
- Mark as New
- Bookmark
- Subscribe
- Mute
- Subscribe to RSS Feed
- Permalink
- Report Inappropriate Content
I've made up a little demo QVW with a stripped down hierarchy. There are some diamond shapes in the hierarchy (please see pic).
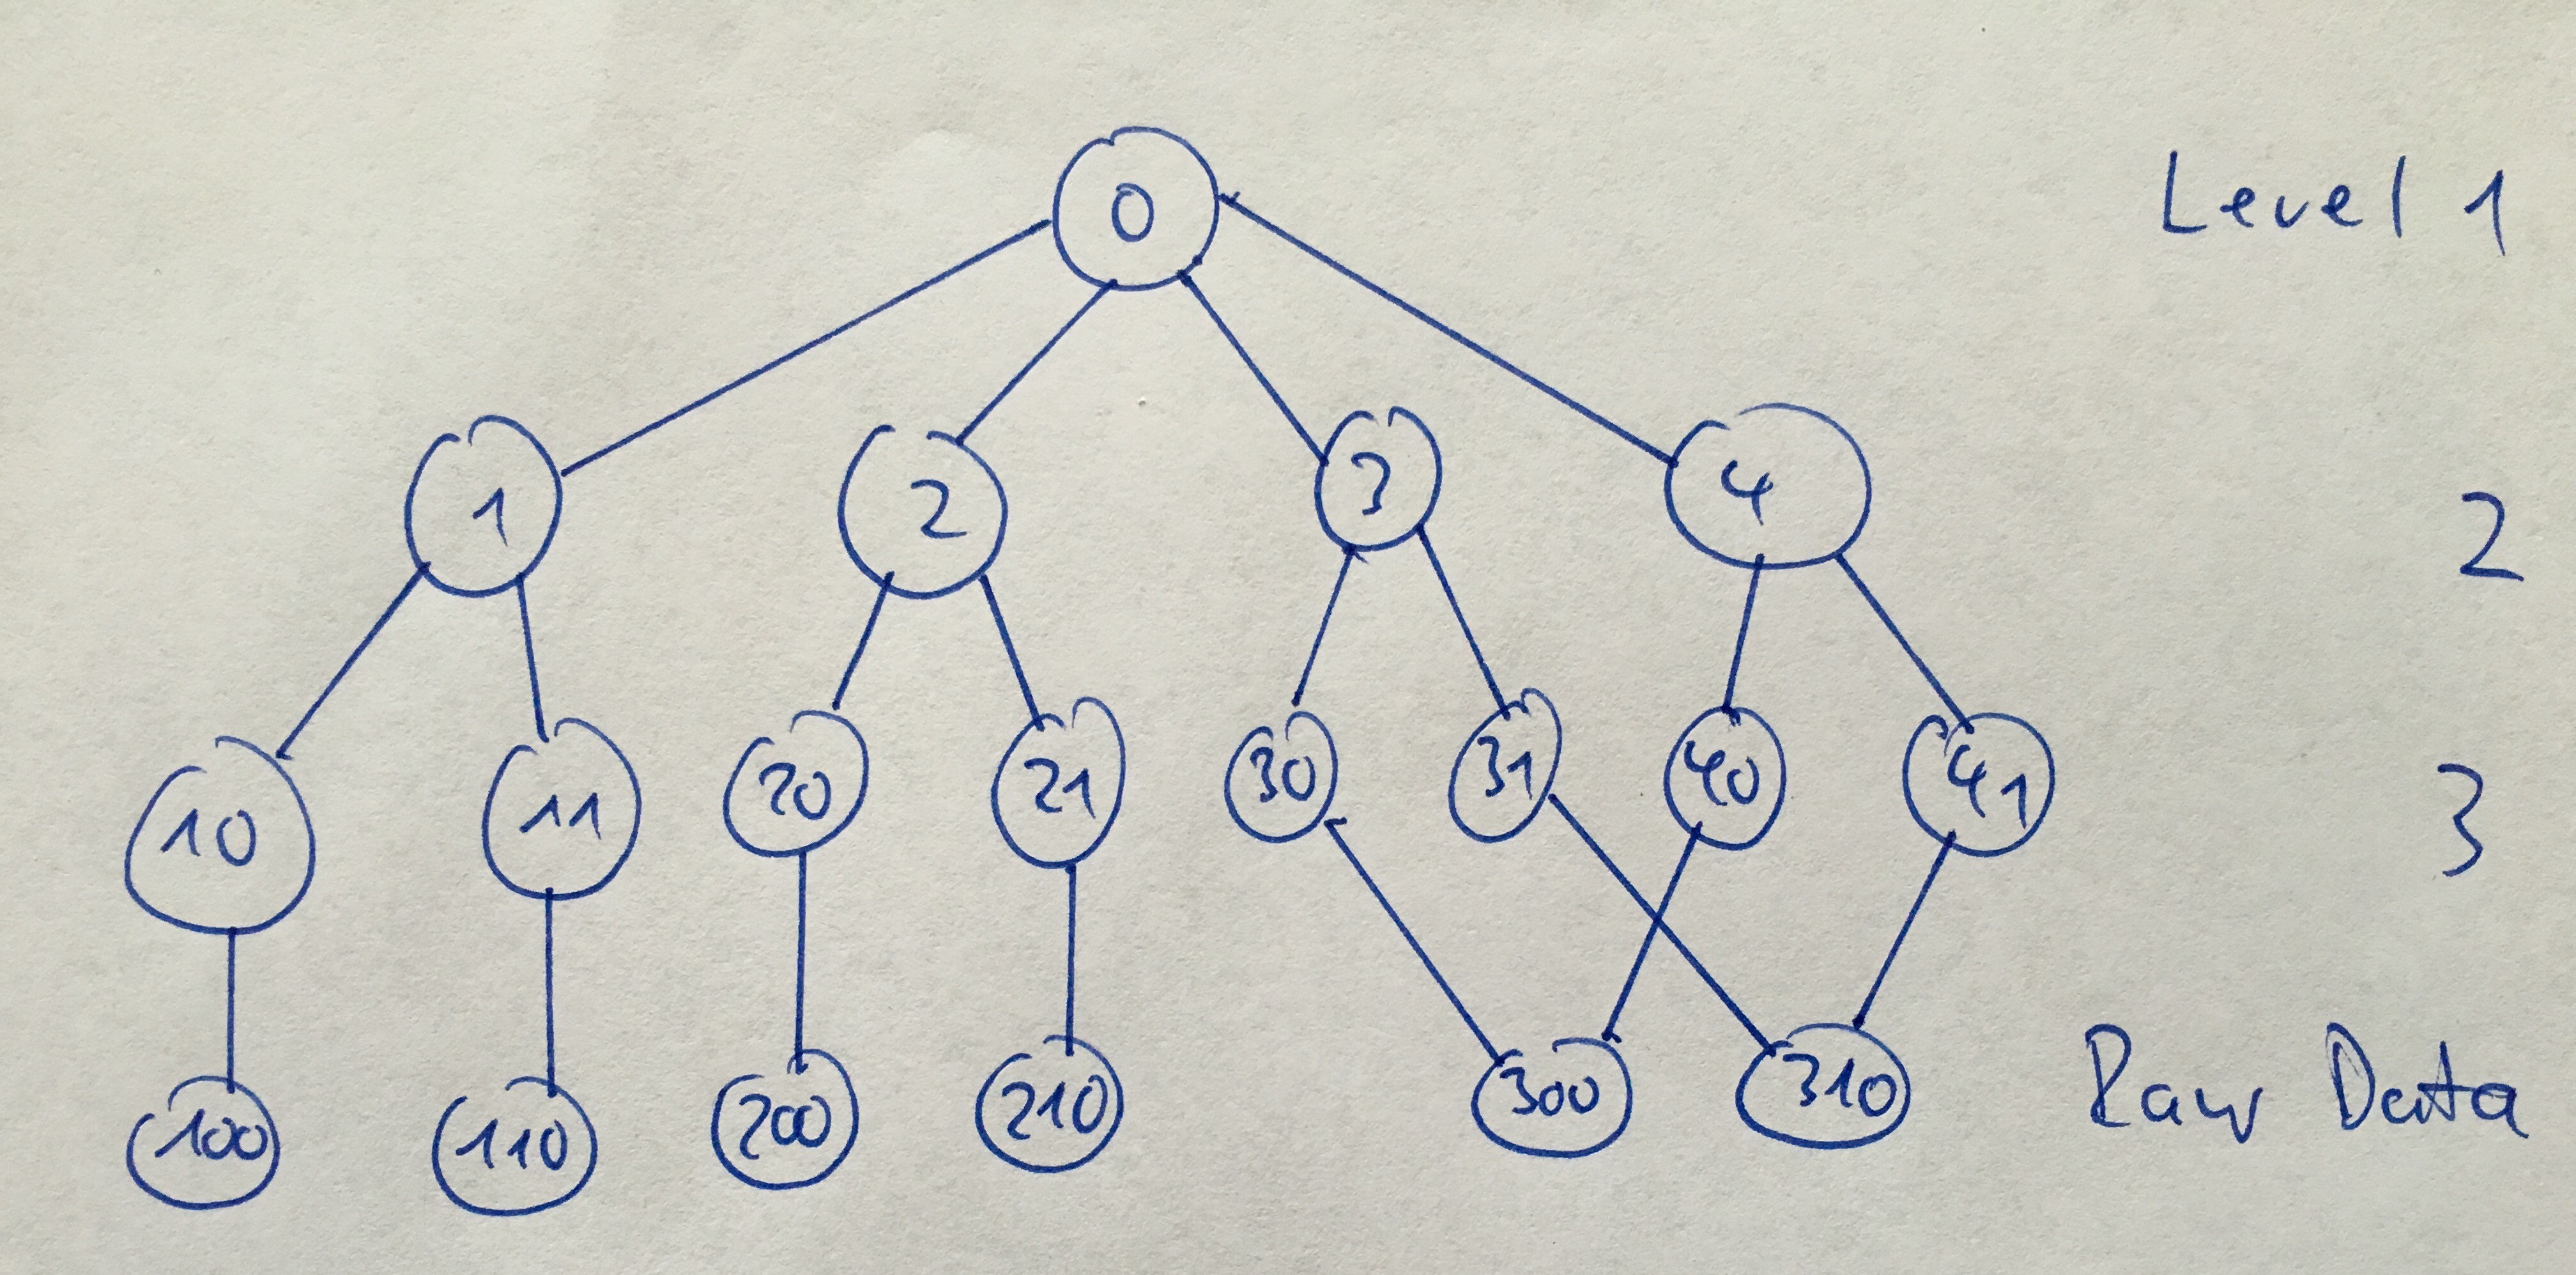
The expression you suggested ("Sum( Aggr( sum({<TEXT_R= >} TOTAL<SKEY_Z> F1), TEXT_R, SKEY_Z))") leads to the right values except for the totals. It also assumes that the Column "Units L1-0" refers to the grand total of the hierarchy. What I'm ultimately looking for is a formula to calculate the sum of units for an arbitrary member of the dimension. That means, instead of L1-0 it might as well be L2-2 or the parent of the respective member. It must not necessarily be the top member of the hierarchy.
I hope I could make my point more clear now. It's not that easy to describe. 🙂
Many thanks in advance
Frank
- Mark as New
- Bookmark
- Subscribe
- Mute
- Subscribe to RSS Feed
- Permalink
- Report Inappropriate Content
Maybe something like attached?
- Mark as New
- Bookmark
- Subscribe
- Mute
- Subscribe to RSS Feed
- Permalink
- Report Inappropriate Content
Thank you very much! Alternate states seem the way to go. Your solution works quite well!
I still have two issues:
1) The expression only deliveres values when the selected benchmark member is not filtered out by the selection of a Region type. If I select L1-0 as benchmark and set a filter to see only Level 2 members, the results of the expression are 0.
2) How can the benchmark be set without using a listbox? Can it also be set dependent on the current member in the pivot table (context sensitive)?
Many thanks again!
Frank
- Mark as New
- Bookmark
- Subscribe
- Mute
- Subscribe to RSS Feed
- Permalink
- Report Inappropriate Content
The first requirement can be solved by clearing the appropriate field selections in the set expression:
if(column(1),Sum ({<TEXT_R= {'$(=Maxstring({AS} TEXT_R))'}, NODE_TYPE_R= >} TOTAL<SKEY_Z> Aggr( sum({<TEXT_R= {'$(=Maxstring({AS} TEXT_R))'}, NODE_TYPE_R= >} TOTAL<SKEY_Z> F1), TEXT_R, SKEY_Z)))
Regarding the second requirement, I think you just need to create an expression that returns the correct value, i.e.
instead
=Maxstring({AS} TEXT_R)
which will return a selection from the alternate state listbox, we would need something else. What would be the rule to determine the single TEXT_R value you want to use as benchmark, for any given set of possible dimension values?
Besides this, I would recommend that you are looking in the HIERARCHY LOAD in the reference manual and
This may allow you to potentially solve your requirements in the data model.
- « Previous Replies
-
- 1
- 2
- Next Replies »