Unlock a world of possibilities! Login now and discover the exclusive benefits awaiting you.
- Qlik Community
- :
- Forums
- :
- Analytics & AI
- :
- Products & Topics
- :
- App Development
- :
- Re: Aggregating data for subsets in QlikSense
- Subscribe to RSS Feed
- Mark Topic as New
- Mark Topic as Read
- Float this Topic for Current User
- Bookmark
- Subscribe
- Mute
- Printer Friendly Page
- Mark as New
- Bookmark
- Subscribe
- Mute
- Subscribe to RSS Feed
- Permalink
- Report Inappropriate Content
Aggregating data for subsets in QlikSense
Hi all,
I've been working on trying to aggregate data in a certain way for use as a consumption reporting tool
I have not been able to come up with a way that works to show consumption the way I am being asked to show it.
1) The data - here is an example of the data set I am working with.
| Year | Month | Area | Product Type | Product ID | Product Material Addition | Material Identifier | Material Suplier | Test Type | Test Result |
| 2017 | 1 | a | aa | 1aa | 14000 | x | xx | xxx | 0.14 |
| 2017 | 1 | a | aa | 1aa | 14000 | x | xx | xxy | 0.5 |
| 2017 | 1 | a | aa | 1aa | 14000 | x | xx | xxz | 0.36 |
| 2017 | 1 | a | aa | 1aa | 13700 | x | xy | xyx | 0.15 |
| 2017 | 1 | a | aa | 1aa | 13700 | x | xy | xyy | 0.52 |
| 2017 | 1 | a | aa | 1aa | 13700 | x | xy | xyz | 0.33 |
| 2017 | 1 | a | aa | 1aa | 500 | y | yy | yxx | 0.75 |
| 2017 | 1 | a | aa | 1aa | 500 | y | yy | yxy | 0.25 |
| 2017 | 1 | b | aa | 1aa | 6000 | z | zz | zzx | 0.5 |
| 2017 | 1 | b | aa | 1aa | 6000 | z | zz | zzy | 0.5 |
| 2017 | 1 | a | aa | 1ab | 40000 | x | xx | xxx | 0.14 |
| 2017 | 1 | a | aa | 1ab | 40000 | x | xx | xxy | 0.5 |
| 2017 | 1 | a | aa | 1ab | 40000 | x | xx | xxz | 0.36 |
| 2017 | 1 | a | aa | 1ab | 1000 | y | yy | yxx | 0.75 |
| 2017 | 1 | a | aa | 1ab | 1000 | y | yy | yxy | 0.25 |
| 2017 | 1 | a | bb | 1ba | 10 | y | yy | yxx | 0.75 |
| 2017 | 1 | a | bb | 1ba | 10 | y | yy | yxy | 0.25 |
| 2017 | 2 | a | aa | 2aa | 40000 | x | xy | xyx | 0.15 |
| 2017 | 2 | a | aa | 2aa | 40000 | x | xy | xyy | 0.52 |
| 2017 | 2 | a | aa | 2aa | 40000 | x | xy | xyz | 0.33 |
| 2017 | 2 | b | aa | 2aa | 7000 | z | zz | zzx | 0.5 |
| 2017 | 2 | b | aa | 2aa | 7000 | z | zz | zzy | 0.5 |
| 2017 | 2 | a | bb | 2ba | 70 | y | yy | yxx | 0.75 |
| 2017 | 2 | a | bb | 2ba | 70 | y | yy | yxy | 0.25 |
2) Output Desired: Ultimately what I need is a summation of the column Product Material Addition divided by the count of distinct product ID's such that I get an averaged consumption for an aggregation on material, product type, area, and/or date in any combinations.
ex. Aggregation on product type and material identifier
| Product Type | Material Identifier | Product Material Addition | # of distinct Product ID | Consumption |
| aa | x | 323100 | 3 | 107700 |
| aa | y | 3000 | 3 | 1000 |
| aa | z | 26000 | 3 | 8666.666667 |
Using the formula sum([Product Material Addition])/count(distinct [Product ID]) results in getting a sum of the material additions when the material is used as shown below
| Product Type | Material Identifier | Product Material Addition | # of distinct Product ID | Consumption |
| aa | x | 323100 | 3 | 107700 |
| aa | y | 3000 | 2 | 1500 |
| aa | z | 26000 | 2 | 13000 |
I've also attempted to use sum([Product Material Addition])/count(total distinct [Product ID]) however that results in a total number that does not change with respect to the desired aggregation
| Product Type | Material Identifier | Product Material Addition | # of total distinct Product ID | Consumption |
| aa | x | 323100 | 5 | 64620 |
| aa | y | 3000 | 5 | 600 |
| aa | z | 26000 | 5 | 5200 |
Any help would be appreciated in solving this problem.
Accepted Solutions
- Mark as New
- Bookmark
- Subscribe
- Mute
- Subscribe to RSS Feed
- Permalink
- Report Inappropriate Content
Try this
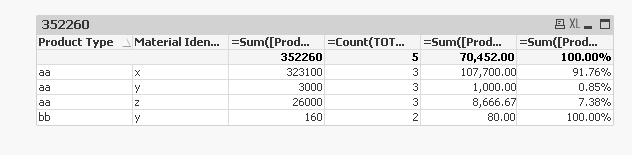
=Sum([Product Material Addition])/Count(TOTAL <[Product Type]> DISTINCT [Product ID])
- Mark as New
- Bookmark
- Subscribe
- Mute
- Subscribe to RSS Feed
- Permalink
- Report Inappropriate Content
As another question
How can I aggregate the total movements to give myself a % of total movements?
I.e
| Product Type | Material Identifier | Product Material Addition | aggregated | Consumption |
| aa | x | 323100 | 352100 | 0.917637035 |
| aa | y | 3000 | 352100 | 0.008520307 |
| aa | z | 26000 | 352100 | 0.073842658 |
when i use the Aggr(sum([product material addition]),Product Type) function it only returns data for the first value.
- Mark as New
- Bookmark
- Subscribe
- Mute
- Subscribe to RSS Feed
- Permalink
- Report Inappropriate Content
Try this
=Sum([Product Material Addition])/Count(TOTAL <[Product Type]> DISTINCT [Product ID])
- Mark as New
- Bookmark
- Subscribe
- Mute
- Subscribe to RSS Feed
- Permalink
- Report Inappropriate Content
May be this
=Sum([Product Material Addition])/Sum(TOTAL <[Product Type]> [Product Material Addition])
- Mark as New
- Bookmark
- Subscribe
- Mute
- Subscribe to RSS Feed
- Permalink
- Report Inappropriate Content
Am I able to put multiple parameters into the <> where product type is?
I.e. if I want month and product type?
- Mark as New
- Bookmark
- Subscribe
- Mute
- Subscribe to RSS Feed
- Permalink
- Report Inappropriate Content
Yes you can 