Unlock a world of possibilities! Login now and discover the exclusive benefits awaiting you.

Announcements
Q&A with Qlik - Qlik Cloud Migration: Questions about migrating to Qlik Cloud? Catch the latest replay!
- Qlik Community
- :
- Forums
- :
- Analytics & AI
- :
- Products & Topics
- :
- App Development
- :
- All item total vs filtered single item total in ba...
Options
- Subscribe to RSS Feed
- Mark Topic as New
- Mark Topic as Read
- Float this Topic for Current User
- Bookmark
- Subscribe
- Mute
- Printer Friendly Page
Turn on suggestions
Auto-suggest helps you quickly narrow down your search results by suggesting possible matches as you type.
Showing results for

Anonymous
Not applicable
2018-05-24
03:54 AM
- Mark as New
- Bookmark
- Subscribe
- Mute
- Subscribe to RSS Feed
- Permalink
- Report Inappropriate Content
All item total vs filtered single item total in bar chart
Hi I have a problem where the value shown when highlighted an item and showing all is different in the bar chart.
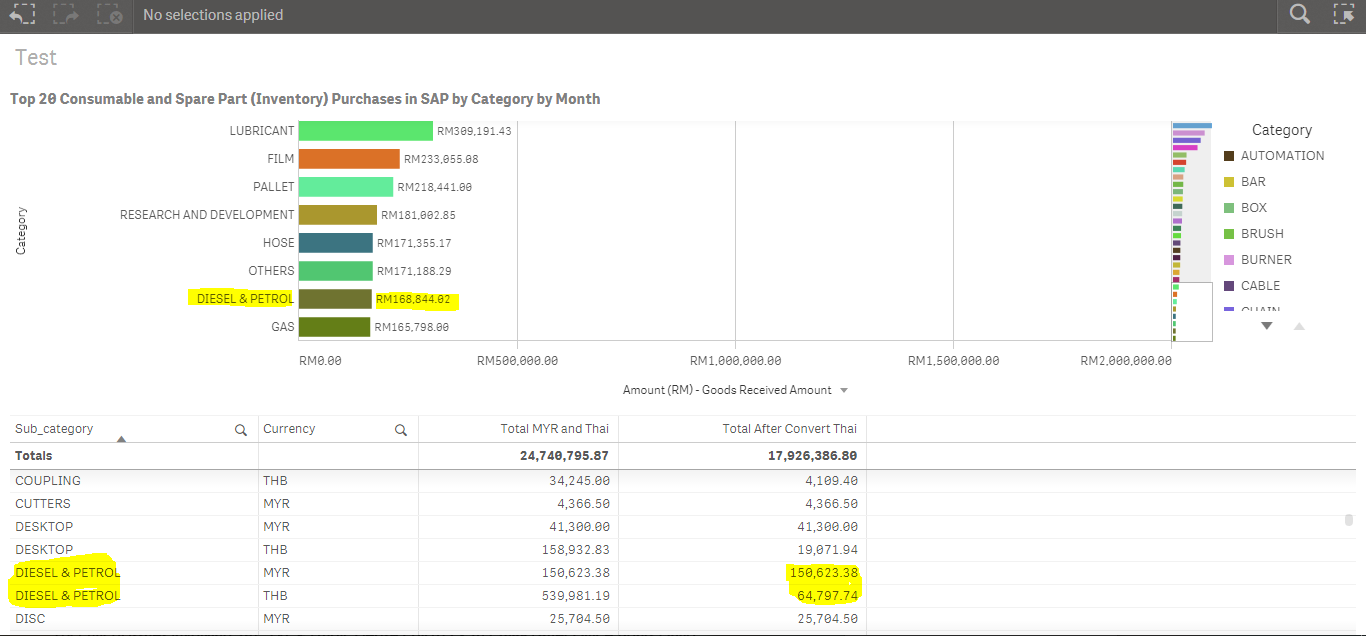
Once filtered, the value is correct
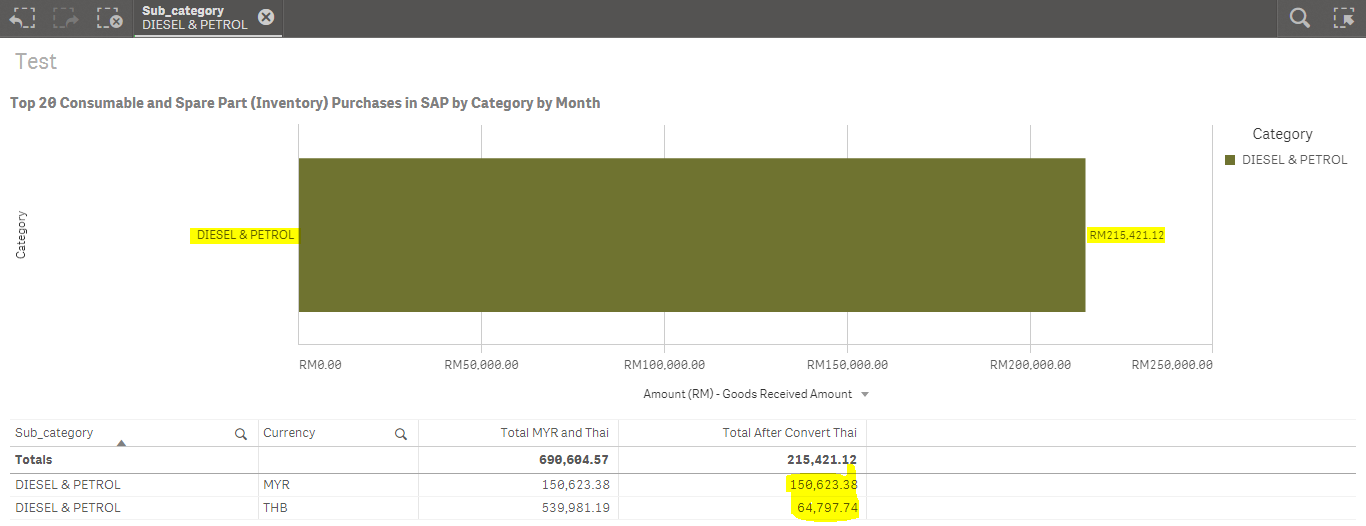
What's the issue. Ill upload the QVF file together !
- Tags:
- bar chart
942 Views
1 Solution
Accepted Solutions

 sunny_talwar
MVP
2018-05-24
08:13 AM
- Mark as New
- Bookmark
- Subscribe
- Mute
- Subscribe to RSS Feed
- Permalink
- Report Inappropriate Content
Try this
Sum(Aggr(IF(Currency = 'THB', SUM(GRAmount)*vThaiRate, SUM(GRAmount)*1), Sub_category, Currency))
883 Views
2 Replies
sunny_talwar
MVP
2018-05-24
08:13 AM
- Mark as New
- Bookmark
- Subscribe
- Mute
- Subscribe to RSS Feed
- Permalink
- Report Inappropriate Content
Try this
Sum(Aggr(IF(Currency = 'THB', SUM(GRAmount)*vThaiRate, SUM(GRAmount)*1), Sub_category, Currency))
884 Views
Anonymous
Not applicable
2018-05-24
08:49 PM
Author
- Mark as New
- Bookmark
- Subscribe
- Mute
- Subscribe to RSS Feed
- Permalink
- Report Inappropriate Content
this works, and solved
883 Views