Unlock a world of possibilities! Login now and discover the exclusive benefits awaiting you.
- Qlik Community
- :
- Forums
- :
- Analytics & AI
- :
- Products & Topics
- :
- App Development
- :
- Re: Auto generate fixed nbr of columns and rows?
- Subscribe to RSS Feed
- Mark Topic as New
- Mark Topic as Read
- Float this Topic for Current User
- Bookmark
- Subscribe
- Mute
- Printer Friendly Page
- Mark as New
- Bookmark
- Subscribe
- Mute
- Subscribe to RSS Feed
- Permalink
- Report Inappropriate Content
Auto generate fixed nbr of columns and rows?
Hi All,
There is a floor with the dimension 141 * 50 ( lenght * breath).
I want to create a table that resembles the above floor wihth 141 columns and 50 rows.
The column should start with A,B........AB,AC.......so on and the rows should start from 1 to 50.
In essence I'm trying to create a grid using a table object
- Tags:
- qlik community
- « Previous Replies
-
- 1
- 2
- Next Replies »
Accepted Solutions
- Mark as New
- Bookmark
- Subscribe
- Mute
- Subscribe to RSS Feed
- Permalink
- Report Inappropriate Content
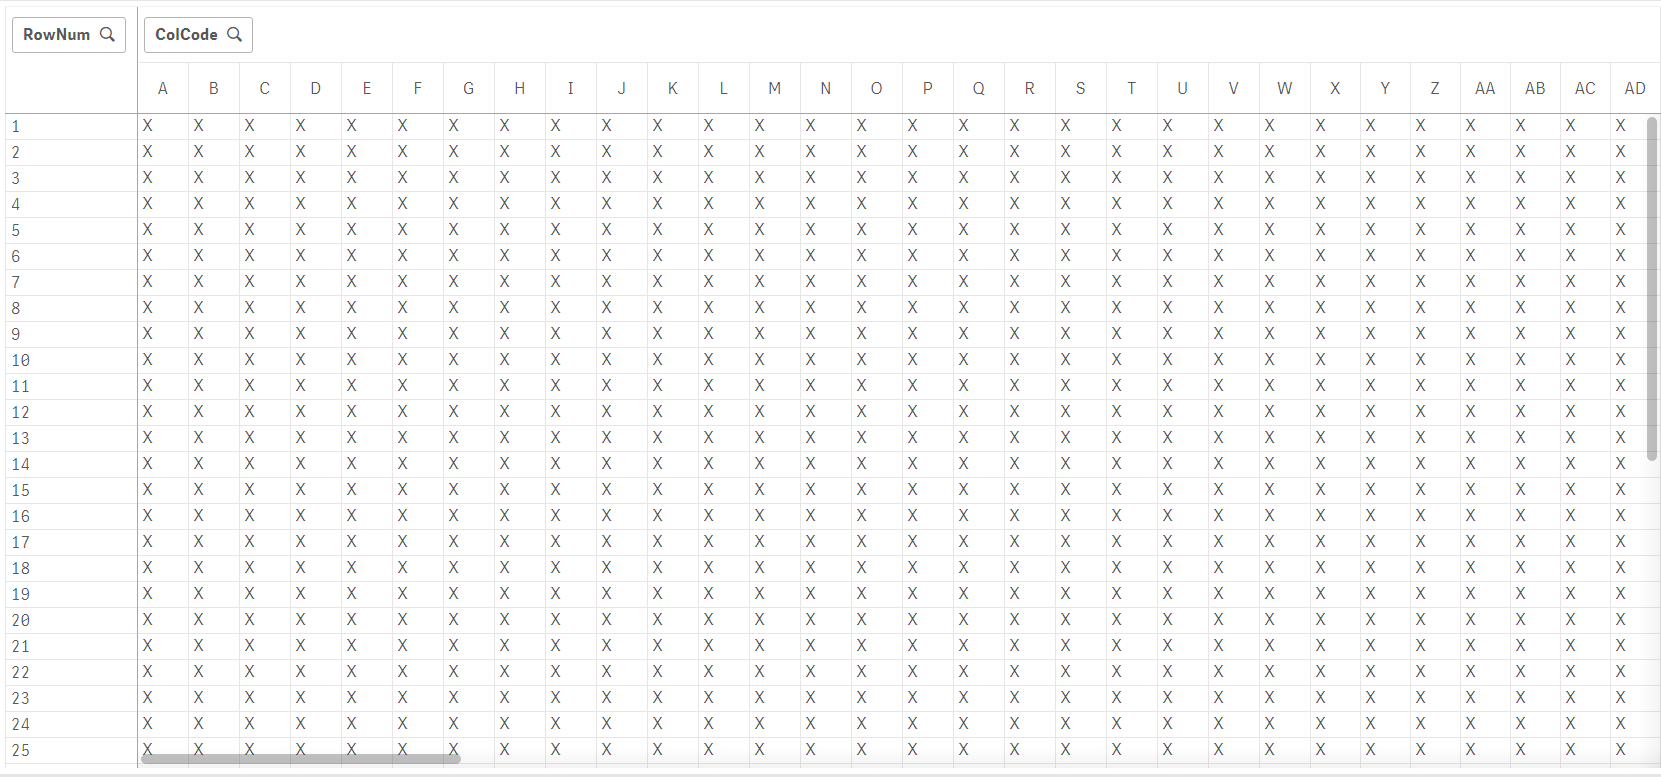
Are you trying to always explicitly generate the floor diagram with these dimensions? If so then the script below will generate a table called FloorDiagram. This contains the data for your 50 x 141 cell grid.
Then create a Pivot Table as follows:
- RowNum as the Row Dimension
- ColCode as the Column Dimension
- Whatever you need as your measure. I don't know what you want in the cell, so I just used a constant as the Measure.
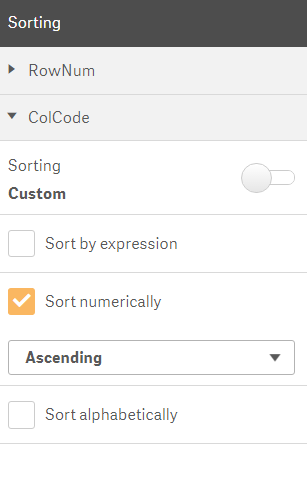
- Change the Sorting on ColCode to only Sort Numerically, Ascending.
I've attached a partial screen shot of the resulting pivot table and the data and sorting sections.
Here is the script.
CharMap:
Mapping Load * Inline [
Num, Char
01,A
02,B
03,C
04,D
05,E
06,F
07,G
08,H
09,I
10,J
11,K
12,L
13,M
14,N
15,O
16,P
17,Q
18,R
19,S
20,T
21,U
22,V
23,W
24,X
25,Y
26,Z
];

Columns:
Load
    1 as Key,
    If(RowNo() < 27,
        MapSubString('CharMap',
	    If(RowNo() < 10,
    	        '0' & RowNo(),
        	    RowNo()
             )
        ),
	MapSubString('CharMap',
	    If(Floor(RowNo() / 26) - If(Mod(RowNo(), 26) = 0, 1, 0) < 10,
    	      '0' & (Floor(RowNo() / 26) - If(Mod(RowNo(), 26) = 0, 1, 0)),
              Floor(RowNo() / 26) - If(Mod(RowNo(), 26) = 0, 1, 0)
              )
        ) &
	MapSubString('CharMap',
	    If(Mod(RowNo(), 26) < 10,
    	      '0' & (Mod(RowNo(), 26) + If(Mod(RowNo(), 26) = 0, 1, 0)),
              Mod(RowNo(), 26)
              )
        )
     ) as ColCode,
     RowNo() as ColOrder
AutoGenerate 141;

FloorDiagram:
Load
    RowNo() as RowNum,
    1 as Key
AutoGenerate 50;

FloorDiagram:
Left Join (FloorDiagram)
Load
    Key,
    Dual(ColCode, ColOrder) as ColCode
Resident Columns;

Drop Field Key From FloorDiagram;

Drop Table Columns;
- Mark as New
- Bookmark
- Subscribe
- Mute
- Subscribe to RSS Feed
- Permalink
- Report Inappropriate Content
Are you trying to always explicitly generate the floor diagram with these dimensions? If so then the script below will generate a table called FloorDiagram. This contains the data for your 50 x 141 cell grid.
Then create a Pivot Table as follows:
- RowNum as the Row Dimension
- ColCode as the Column Dimension
- Whatever you need as your measure. I don't know what you want in the cell, so I just used a constant as the Measure.
- Change the Sorting on ColCode to only Sort Numerically, Ascending.
I've attached a partial screen shot of the resulting pivot table.
Here is the script.
CharMap:
Mapping Load * Inline [
Num, Char
01,A
02,B
03,C
04,D
05,E
06,F
07,G
08,H
09,I
10,J
11,K
12,L
13,M
14,N
15,O
16,P
17,Q
18,R
19,S
20,T
21,U
22,V
23,W
24,X
25,Y
26,Z
];

Columns:
Load
    1 as Key,
    If(RowNo() < 27,
        MapSubString('CharMap',
	    If(RowNo() < 10,
    	        '0' & RowNo(),
        	    RowNo()
             )
        ),
	MapSubString('CharMap',
	    If(Floor(RowNo() / 26) - If(Mod(RowNo(), 26) = 0, 1, 0) < 10,
    	      '0' & (Floor(RowNo() / 26) - If(Mod(RowNo(), 26) = 0, 1, 0)),
              Floor(RowNo() / 26) - If(Mod(RowNo(), 26) = 0, 1, 0)
              )
        ) &
	MapSubString('CharMap',
	    If(Mod(RowNo(), 26) < 10,
    	      '0' & (Mod(RowNo(), 26) + If(Mod(RowNo(), 26) = 0, 1, 0)),
              Mod(RowNo(), 26)
              )
        )
     ) as ColCode,
     RowNo() as ColOrder
AutoGenerate 141;

FloorDiagram:
Load
    RowNo() as RowNum,
    1 as Key
AutoGenerate 50;

FloorDiagram:
Left Join (FloorDiagram)
Load
    Key,
    Dual(ColCode, ColOrder) as ColCode
Resident Columns;

Drop Field Key From FloorDiagram;

Drop Table Columns;
- Mark as New
- Bookmark
- Subscribe
- Mute
- Subscribe to RSS Feed
- Permalink
- Report Inappropriate Content
Here is the attachment. The editor wasn't letting me add it to the prior post.
- Mark as New
- Bookmark
- Subscribe
- Mute
- Subscribe to RSS Feed
- Permalink
- Report Inappropriate Content
If you don't need just a two column-table which you expand within a pivot else a real table within the datamodel you could use something like this:
t1: load *, 1 as ID, chr(64 + if(Cluster = 1, null(), Cluster -1)) &
                     chr(64 + recno() - ((Cluster - 1) * 26)) as Column;
    load ceil(recno() / 26) as Cluster autogenerate 141;

t2: generic load 1 as ID, recno() as Row, 'X' as Dummy autogenerate 50;

for i = nooftables() to 0 step -1
	let vTable = tablename($(i));
	if left('$(vTable)', 2) = 't2' then
		left join (t1) load * resident $(vTable);
		drop tables $(vTable);
	end if
next
- Marcus
- Mark as New
- Bookmark
- Subscribe
- Mute
- Subscribe to RSS Feed
- Permalink
- Report Inappropriate Content
You can use a Synthetic dimension with ValueLoop expression to create the grid.
More o less is like a waffle chart like this https://qvdesign.wordpress.com/2012/02/16/new-qlikview-proportional-waffle-charts/
Other solution will be generate the set of data in the script using a loop.
Ag+
- Mark as New
- Bookmark
- Subscribe
- Mute
- Subscribe to RSS Feed
- Permalink
- Report Inappropriate Content
Are you trying to always explicitly generate the floor diagram with these dimensions? If so then the script below will generate a table called FloorDiagram. This contains the data for your 50 x 141 cell grid.
Then create a Pivot Table as follows:
- RowNum as the Row Dimension
- ColCode as the Column Dimension
- Whatever you need as your measure. I don't know what you want in the cell, so I just used a constant as the Measure.
- Change the Sorting on ColCode to only Sort Numerically, Ascending.
I've attached a partial screen shot of the resulting pivot table and the data and sorting sections.
Here is the script.
CharMap:
Mapping Load * Inline [
Num, Char
01,A
02,B
03,C
04,D
05,E
06,F
07,G
08,H
09,I
10,J
11,K
12,L
13,M
14,N
15,O
16,P
17,Q
18,R
19,S
20,T
21,U
22,V
23,W
24,X
25,Y
26,Z
];

Columns:
Load
    1 as Key,
    If(RowNo() < 27,
        MapSubString('CharMap',
	    If(RowNo() < 10,
    	        '0' & RowNo(),
        	    RowNo()
             )
        ),
	MapSubString('CharMap',
	    If(Floor(RowNo() / 26) - If(Mod(RowNo(), 26) = 0, 1, 0) < 10,
    	      '0' & (Floor(RowNo() / 26) - If(Mod(RowNo(), 26) = 0, 1, 0)),
              Floor(RowNo() / 26) - If(Mod(RowNo(), 26) = 0, 1, 0)
              )
        ) &
	MapSubString('CharMap',
	    If(Mod(RowNo(), 26) < 10,
    	      '0' & (Mod(RowNo(), 26) + If(Mod(RowNo(), 26) = 0, 1, 0)),
              Mod(RowNo(), 26)
              )
        )
     ) as ColCode,
     RowNo() as ColOrder
AutoGenerate 141;

FloorDiagram:
Load
    RowNo() as RowNum,
    1 as Key
AutoGenerate 50;

FloorDiagram:
Left Join (FloorDiagram)
Load
    Key,
    Dual(ColCode, ColOrder) as ColCode
Resident Columns;

Drop Field Key From FloorDiagram;

Drop Table Columns;
- Mark as New
- Bookmark
- Subscribe
- Mute
- Subscribe to RSS Feed
- Permalink
- Report Inappropriate Content
Are you trying to always explicitly generate the floor diagram with these dimensions? If so then the script below will generate a table called FloorDiagram. This contains the data for your 50 x 141 cell grid.
Then create a Pivot Table as follows:
- RowNum as the Row Dimension
- ColCode as the Column Dimension
- Whatever you need as your measure. I don't know what you want in the cell, so I just used a constant as the Measure.
- Change the Sorting on ColCode to only Sort Numerically, Ascending.
I've attached a partial screen shot of the resulting pivot table.
Here is the script.
CharMap:
Mapping Load * Inline [
Num, Char
01,A
02,B
03,C
04,D
05,E
06,F
07,G
08,H
09,I
10,J
11,K
12,L
13,M
14,N
15,O
16,P
17,Q
18,R
19,S
20,T
21,U
22,V
23,W
24,X
25,Y
26,Z
];

Columns:
Load
    1 as Key,
    If(RowNo() < 27,
        MapSubString('CharMap',
	    If(RowNo() < 10,
    	        '0' & RowNo(),
        	    RowNo()
             )
        ),
	MapSubString('CharMap',
	    If(Floor(RowNo() / 26) - If(Mod(RowNo(), 26) = 0, 1, 0) < 10,
    	      '0' & (Floor(RowNo() / 26) - If(Mod(RowNo(), 26) = 0, 1, 0)),
              Floor(RowNo() / 26) - If(Mod(RowNo(), 26) = 0, 1, 0)
              )
        ) &
	MapSubString('CharMap',
	    If(Mod(RowNo(), 26) < 10,
    	      '0' & (Mod(RowNo(), 26) + If(Mod(RowNo(), 26) = 0, 1, 0)),
              Mod(RowNo(), 26)
              )
        )
     ) as ColCode,
     RowNo() as ColOrder
AutoGenerate 141;

FloorDiagram:
Load
    RowNo() as RowNum,
    1 as Key
AutoGenerate 50;

FloorDiagram:
Left Join (FloorDiagram)
Load
    Key,
    Dual(ColCode, ColOrder) as ColCode
Resident Columns;

Drop Field Key From FloorDiagram;

Drop Table Columns;
- Mark as New
- Bookmark
- Subscribe
- Mute
- Subscribe to RSS Feed
- Permalink
- Report Inappropriate Content
Here is the attachment. The editor wasn't letting me add it to the prior post.
- Mark as New
- Bookmark
- Subscribe
- Mute
- Subscribe to RSS Feed
- Permalink
- Report Inappropriate Content
If you don't need just a two column-table which you expand within a pivot else a real table within the datamodel you could use something like this:
t1: load *, 1 as ID, chr(64 + if(Cluster = 1, null(), Cluster -1)) &
                     chr(64 + recno() - ((Cluster - 1) * 26)) as Column;
    load ceil(recno() / 26) as Cluster autogenerate 141;

t2: generic load 1 as ID, recno() as Row, 'X' as Dummy autogenerate 50;

for i = nooftables() to 0 step -1
	let vTable = tablename($(i));
	if left('$(vTable)', 2) = 't2' then
		left join (t1) load * resident $(vTable);
		drop tables $(vTable);
	end if
next
- Marcus
- Mark as New
- Bookmark
- Subscribe
- Mute
- Subscribe to RSS Feed
- Permalink
- Report Inappropriate Content
Thank you Guys..appreciate your help.I'll get back to you all after testing the code
- Mark as New
- Bookmark
- Subscribe
- Mute
- Subscribe to RSS Feed
- Permalink
- Report Inappropriate Content
Worked like a charm. Thank you guys for the help.
- « Previous Replies
-
- 1
- 2
- Next Replies »