Unlock a world of possibilities! Login now and discover the exclusive benefits awaiting you.
Announcements
Now accepting applications for the Qlik Luminary and Partner Ambassador Programs: Apply by July 6!
- Qlik Community
- :
- Forums
- :
- Analytics & AI
- :
- Products & Topics
- :
- App Development
- :
- Re: Average AVG bar in bar chart
Options
- Subscribe to RSS Feed
- Mark Topic as New
- Mark Topic as Read
- Float this Topic for Current User
- Bookmark
- Subscribe
- Mute
- Printer Friendly Page
Turn on suggestions
Auto-suggest helps you quickly narrow down your search results by suggesting possible matches as you type.
Showing results for
Anonymous
Not applicable
2017-12-15
09:00 AM
- Mark as New
- Bookmark
- Subscribe
- Mute
- Subscribe to RSS Feed
- Permalink
- Report Inappropriate Content
Average AVG bar in bar chart
Hello! I set up a graph where the bars represent the total amount spent. The red line should be a (straight) line with the average value of the month being shown. How do I make the line representing the mean stay (straight) equally?
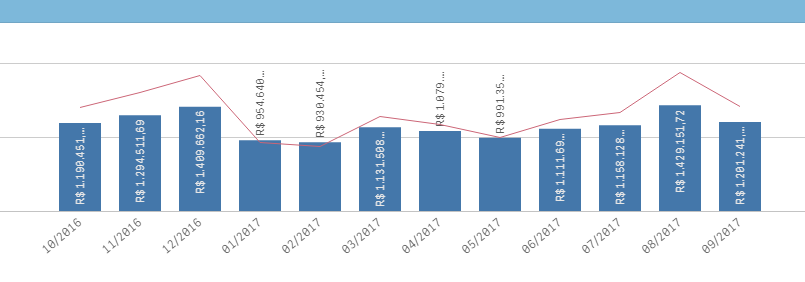
I would like it to be this way:

Thank you for your attention and help.
1,729 Views
2 Replies
MVP
2017-12-15
09:01 AM
- Mark as New
- Bookmark
- Subscribe
- Mute
- Subscribe to RSS Feed
- Permalink
- Report Inappropriate Content
What is your expression for the average line?
1,567 Views
Contributor II
2019-07-25
09:15 AM
- Mark as New
- Bookmark
- Subscribe
- Mute
- Subscribe to RSS Feed
- Permalink
- Report Inappropriate Content
Try adding a Trendline "Average" on the expressions tab.
This should give you this result.
1,484 Views