Unlock a world of possibilities! Login now and discover the exclusive benefits awaiting you.
- Qlik Community
- :
- Forums
- :
- Analytics & AI
- :
- Products & Topics
- :
- App Development
- :
- Re: Calculate peak usage of the POS
- Subscribe to RSS Feed
- Mark Topic as New
- Mark Topic as Read
- Float this Topic for Current User
- Bookmark
- Subscribe
- Mute
- Printer Friendly Page
- Mark as New
- Bookmark
- Subscribe
- Mute
- Subscribe to RSS Feed
- Permalink
- Report Inappropriate Content
Calculate peak usage of the POS
Hello,
Can you help me please?
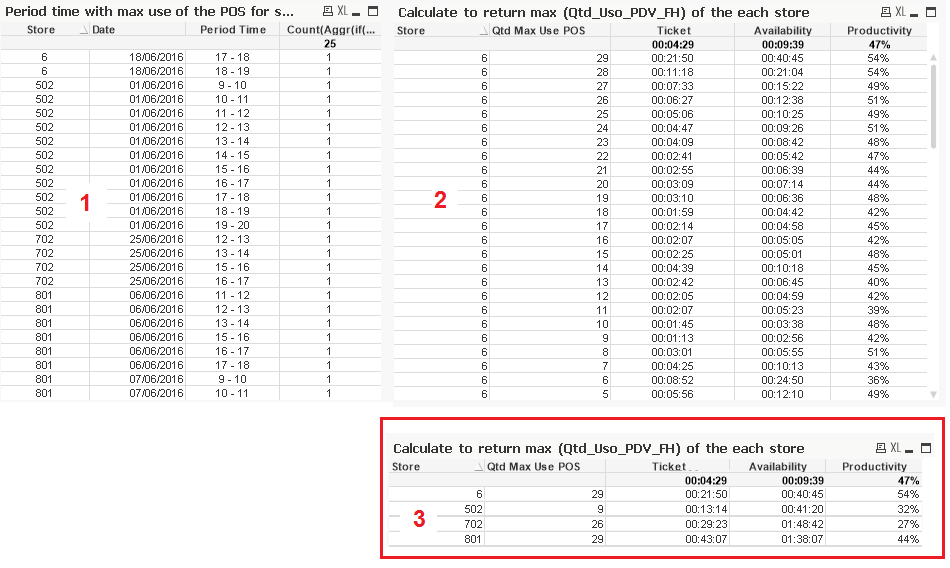
In Table 1, I calculated the maximum use of POS by store, date and period time.
In table 2, shows only the fact table.
I need to know which an expression that returns only the maximum use of the POS as shown in the table 3
Thanks!

- Mark as New
- Bookmark
- Subscribe
- Mute
- Subscribe to RSS Feed
- Permalink
- Report Inappropriate Content
Try as below, or provide a sample app or sample data
=Max(TOTAL <Store> ExpressionforProductivity )
If a post helps to resolve your issue, please accept it as a Solution.
- Mark as New
- Bookmark
- Subscribe
- Mute
- Subscribe to RSS Feed
- Permalink
- Report Inappropriate Content
Hi, Vineeth,
the app is attached now.
- Mark as New
- Bookmark
- Subscribe
- Mute
- Subscribe to RSS Feed
- Permalink
- Report Inappropriate Content
Hi,
I'm not able to access my machine that has a licensed QV, can you telll me the fields used / Expressions you have in the table so I can recreate
If a post helps to resolve your issue, please accept it as a Solution.
- Mark as New
- Bookmark
- Subscribe
- Mute
- Subscribe to RSS Feed
- Permalink
- Report Inappropriate Content
Hi,
Table 1:
Dimensions
Nro_Loja
Qtd_Uso_PDV_FH
Faixa_Horario
Expression
Count(Aggr(if(Rank(Max(Qtd_Uso_PDV_FH),1)=1,1),Nro_Loja,Faixa_Horario))
Table 2: fact table
Dimensions
Nro_Loja
Qtd_Uso_PDV_FH
Expression
Ticket = Sum(Tempo_Cupom)
Availability = Sum(Tempo_Uso)
Productivity = Ticket / Availability
Table 3, is just image. In this table that I need the expression
- Mark as New
- Bookmark
- Subscribe
- Mute
- Subscribe to RSS Feed
- Permalink
- Report Inappropriate Content
Try
Dimension:
Nro_Loja
Expressions:
1) Max(AGGR(MAX(Qtd_Uso_PDV_FH),Nro_Loja))
2) AGGR(if(Qtd_Uso_PDV_FH = MAX(AGGR(NODISTINCT MAX(Qtd_Uso_PDV_FH),Nro_Loja)), sum(Tempo_Cupom)),Nro_Loja,Qtd_Uso_PDV_FH)
3) AGGR(if(Qtd_Uso_PDV_FH = MAX(AGGR(NODISTINCT MAX(Qtd_Uso_PDV_FH),Nro_Loja)), sum(Tempo_Uso)),Nro_Loja,Qtd_Uso_PDV_FH)
4) Colum(2)/Colum(3)
If a post helps to resolve your issue, please accept it as a Solution.
- Mark as New
- Bookmark
- Subscribe
- Mute
- Subscribe to RSS Feed
- Permalink
- Report Inappropriate Content
Hi,
It worked!!!
Thank you so much!
- Mark as New
- Bookmark
- Subscribe
- Mute
- Subscribe to RSS Feed
- Permalink
- Report Inappropriate Content
Hi claudio
Attaching something simpler
Dimensions:
Nro_Loja
calculatedDimension:
=aggr(if(Qtd_Uso_PDV_FH = Max(TOTAL <Nro_Loja> AGGR(MAX(Qtd_Uso_PDV_FH),Nro_Loja,Qtd_Uso_PDV_FH)) , Qtd_Uso_PDV_FH),Nro_Loja,Qtd_Uso_PDV_FH)
<<Check Suppress when value is null() for this dimension
Expressions:
sum(Tempo_Cupom)
sum(Tempo_Uso)
Column(1)/Column(2)
Also please close the thread by marking a response as correct ![]()
Qlik Community Tip: Marking Replies as Correct or Helpful
If a post helps to resolve your issue, please accept it as a Solution.
- Mark as New
- Bookmark
- Subscribe
- Mute
- Subscribe to RSS Feed
- Permalink
- Report Inappropriate Content
Hi,
I have another situation, can you help me, please?
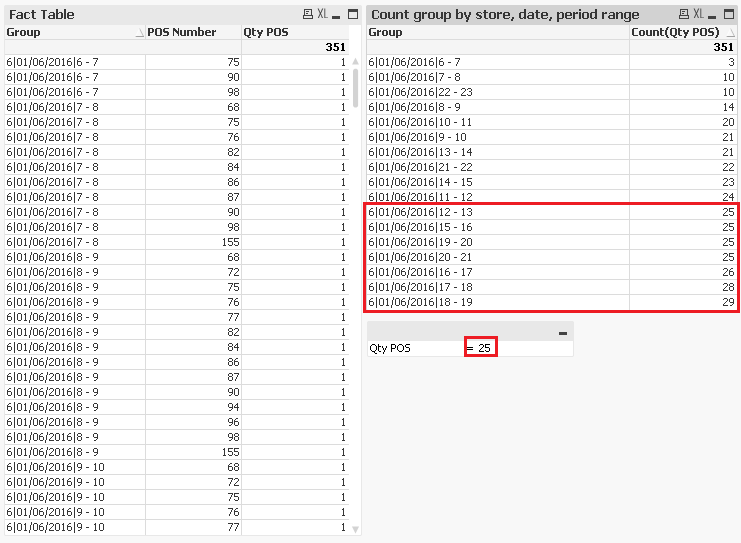
1. Create a bar chart that represents only the time bands where the amount of POS usage is greater than or equal to the value of the variable by calculating the average availability time.
2. Insert a line in the bar chart showing witch is the frequency in periods ranges the amount of POS in use are greater than or equal to the value of the variable.

Thanks in advance!
- Mark as New
- Bookmark
- Subscribe
- Mute
- Subscribe to RSS Feed
- Permalink
- Report Inappropriate Content
If you are still looking for an answer, use the below
=if(Count(Qtd_Uso_PDV_FH)>=$(vQty_POS),Count(Qtd_Uso_PDV_FH))
If a post helps to resolve your issue, please accept it as a Solution.