Unlock a world of possibilities! Login now and discover the exclusive benefits awaiting you.
- Qlik Community
- :
- Forums
- :
- Analytics & AI
- :
- Products & Topics
- :
- App Development
- :
- Re: Calculate specific rows in dimension from load...
- Subscribe to RSS Feed
- Mark Topic as New
- Mark Topic as Read
- Float this Topic for Current User
- Bookmark
- Subscribe
- Mute
- Printer Friendly Page
- Mark as New
- Bookmark
- Subscribe
- Mute
- Subscribe to RSS Feed
- Permalink
- Report Inappropriate Content
Calculate specific rows in dimension from load script?
Hi all,
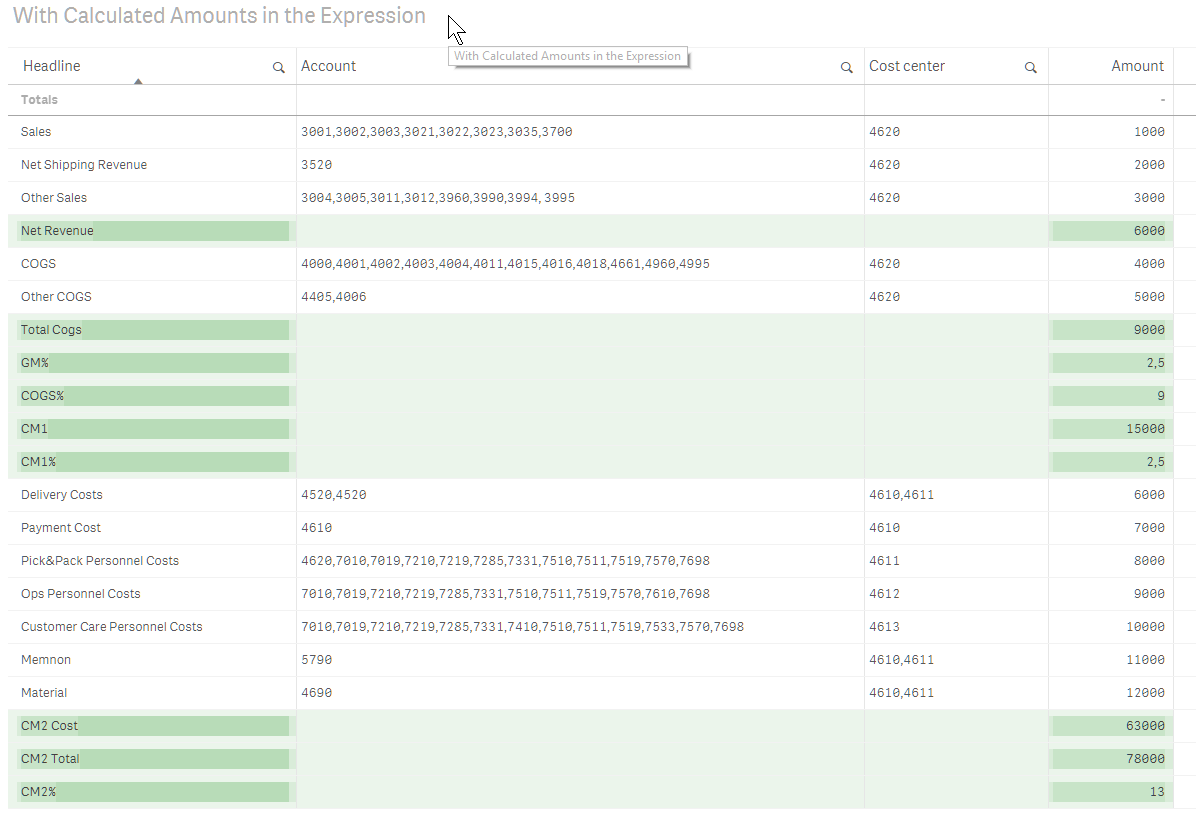
I have a excel file with the following structure (see attached) that I use as a datasource. By sorting the rows this way I get the right calculations and structure in my pivot table. My problem is that in some rows I want to make calculations using the the values from other rows. Is there a way I can accomplish that either in the excel sheet or in the load script?
- Mark as New
- Bookmark
- Subscribe
- Mute
- Subscribe to RSS Feed
- Permalink
- Report Inappropriate Content
The calculations can be done either in the load script or very similarly in the charts instead. I have made an example app that does both.
XL:
LOAD
    Headline,
    If( IsNull(Account) , ' ' , Text(Account)) AS Account,
    If( IsNull([Cost center]),' ' , Text([Cost center])) AS [Cost center],
    Trim([Calculation wanted]) AS C
FROM [lib://Downloads/Example financial report.xlsx]
  (ooxml, embedded labels, table is [Financial report])
WHERE
  RecNo()<=21;

// Give each row a name which is the same as the headline
FOR i=1 TO NoOfRows('XL')
  var = Peek('Headline',i-1);
    [$(var)] = i-1
NEXT

LOAD
    Headline,
    Account,
    [Cost center],
    If( RecNo() = 1 , 1 , If( Left( C , 1 ) = '=' , Peek('C#')+1 , Peek('C#') ) )  AS C#,
    If( Left(C,1) <> '=' , C , Pick( Peek('C#') ,
  RangeSum(Peek('C',$(Sales)),Peek('C',$(Net Shipping Revenue)),Peek('C',$(Other Sales)))
        ,RangeSum(Peek('C',$(COGS)),Peek('C',$(Other COGS)))
        ,RangeSum(Peek('C',$(Net Revenue)),Peek('C',$(Total Cogs)))/Peek('C',$(Net Revenue))
        ,Peek('C',$(Total Cogs))/Peek('C',$(Sales))
        ,Peek('C',$(Net Revenue))+Peek('C',$(Total Cogs))
        ,Peek('C',$(CM1))/Peek('C',$(Net Revenue))
        ,RangeSum(Peek('C',$(Delivery Costs)),Peek('C',$(Payment Cost)),Peek('C',$(Pick&Pack Personnel Costs)),Peek('C',$(Ops Personnel Costs)),Peek('C',$(Customer Care Personnel Costs)),Peek('C',$(Memnon)),Peek('C',$(Material)))
  ,RangeSum(Peek('C',$(CM1)),Peek('C',$(CM2 Cost)))
        ,Peek('C',$(CM2 Total))/Peek('C',$(Net Revenue))
))
    AS C
RESIDENT
  XL
;

DROP TABLE XL;
The calculations in the chart would be as an alternative:
If( Len([Cost center]) > 1 , Sum(C) , Pick( Above(TOTAL C#)
  ,RangeSum(Top(TOTAL Sum(C),$(Sales)+1),Top(TOTAL Sum(C),$(Net Shipping Revenue)+1),Top(TOTAL Sum(C),$(Other Sales)+1))
  ,RangeSum(Top(TOTAL C,$(COGS)+1),Top(TOTAL C,$(Other COGS)+1))
        ,RangeSum(Top(TOTAL C,$(Net Revenue)+1),Top(TOTAL C,$(Total Cogs)+1))/Top(TOTAL C,$(Net Revenue)+1)
        ,Top(TOTAL C,$(Total Cogs)+1)/Top(TOTAL C,$(Sales)+1)
        ,Top(TOTAL C,$(Net Revenue)+1)+Top(TOTAL C,$(Total Cogs)+1)
        ,Top(TOTAL C,$(CM1)+1)/Top(TOTAL C,$(Net Revenue)+1)
        ,RangeSum(Top(TOTAL C,$(Delivery Costs)+1),Top(TOTAL C,$(Payment Cost)+1),Top(TOTAL C,$(Pick&Pack Personnel Costs)+1),Top(TOTAL C,$(Ops Personnel Costs)+1),Top(TOTAL C,$(Customer Care Personnel Costs)+1),Top(TOTAL C,$(Memnon)+1),Top(TOTAL C,$(Material)+1))
  ,RangeSum(Top(TOTAL C,$(CM1)+1),Top(TOTAL C,$(CM2 Cost)+1))
        ,Top(TOTAL C,$(CM2 Total)+1)/Top(TOTAL C,$(Net Revenue)+1)
))
If you prefer to do calculations in the chart you could remove lines 18 to 39 in the load script.