Unlock a world of possibilities! Login now and discover the exclusive benefits awaiting you.
- Qlik Community
- :
- Forums
- :
- Analytics
- :
- App Development
- :
- Re: Calculating percentage of total over the 6 las...
- Subscribe to RSS Feed
- Mark Topic as New
- Mark Topic as Read
- Float this Topic for Current User
- Bookmark
- Subscribe
- Mute
- Printer Friendly Page
- Mark as New
- Bookmark
- Subscribe
- Mute
- Subscribe to RSS Feed
- Permalink
- Report Inappropriate Content
Calculating percentage of total over the 6 last months
Hello,
In the context of industrial reporting, I want to show the distribution of production volume by reference over the last 6 months.
I've already done this for one month, selecting the one you want :
WIth the formula : sum(QuantiteReferences)/sum(total QuantiteReferences)
Now i want to get the 6 previous months before the current date, regardless of the month selection. I have a filter called $(VFiltreMoisPrecedents), which already retrieves the values in the last 6 months.
If you have any advice on how to make the previous formula work, I'd love to hear it,
Thank you.
Accepted Solutions
- Mark as New
- Bookmark
- Subscribe
- Mute
- Subscribe to RSS Feed
- Permalink
- Report Inappropriate Content
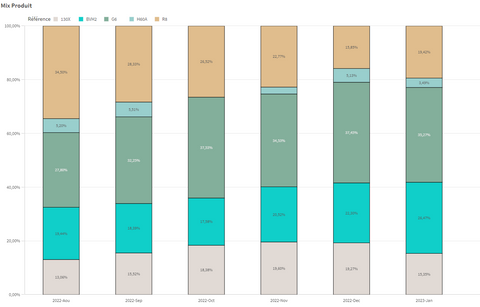
I finally got the formula to work and obtained the desired graph:
With the following formula :
sum({1<Ligne = $::Ligne>}aggr({1<Ligne = $::Ligne>}sum($(VFiltreMoisPrecedents)QuantiteReferences),[Date de production],[Production.TTNRDescription]))
/
Sum({1<Ligne = $::Ligne>}Total <[Date de production.autoCalendar.YearMonth]> QuantiteReferences)
Thank you for your help !
- Mark as New
- Bookmark
- Subscribe
- Mute
- Subscribe to RSS Feed
- Permalink
- Report Inappropriate Content
Hi Florian,
If I understand your question correctly, you'd like to limit the total production in the denominator of your ratio, to the last 6 months. If so, you can use Set Analysis to filter those - something like this:
sum(QuantiteReferences)/sum({<$(VFiltreMoisPrecedents), DateProdYearMonth=>} total QuantiteReferences)
Notice that you need to disregard the selections in the field Month.
Let me invite you to my lecture on Set Analysis and AGGR() at the Masters Summit for Qlik, which will take place online on March 1st. I will be teaching advanced Set Analysis and AGGR() techniques that would help you with problems like this one.
- Mark as New
- Bookmark
- Subscribe
- Mute
- Subscribe to RSS Feed
- Permalink
- Report Inappropriate Content
Hi Oleg,
Thank you for your reply.
If I wasn't very clear, here is the graph I want to get, regardless of the month selection :
I want to make a ratio of volume per reference per month / total volume in the month, and that for the last 6 months.
I can't get the formula you sent me to work. It is important to know that the content of the filter $(VFiltreMoisPrecedents) is :
{<[Date de production]=
,[Date de production]={">=$(=Max(Monthstart(AddMonths(Today(),-$(vNombreMois)+1))) ) <$(=Max(Addmonths(MonthEnd(Today()),0)))"}>} with vNombreMois =6.
Thank you.
- Mark as New
- Bookmark
- Subscribe
- Mute
- Subscribe to RSS Feed
- Permalink
- Report Inappropriate Content
I finally got the formula to work and obtained the desired graph:
With the following formula :
sum({1<Ligne = $::Ligne>}aggr({1<Ligne = $::Ligne>}sum($(VFiltreMoisPrecedents)QuantiteReferences),[Date de production],[Production.TTNRDescription]))
/
Sum({1<Ligne = $::Ligne>}Total <[Date de production.autoCalendar.YearMonth]> QuantiteReferences)
Thank you for your help !
- Mark as New
- Bookmark
- Subscribe
- Mute
- Subscribe to RSS Feed
- Permalink
- Report Inappropriate Content
Hi Florian,
What's the role of AGGR() in the numerator? It looks to me like the same formula should work equally well without it.
Also, this Set Analysis will disregard ANY user selections, except for the field Ligne - is that what you wanted to achieve?
The formula that I suggested didn't work because I assumed that the variable "filter" only includes the filter alone. In your app, the variable "filter" includes the whole Set Analysis expression, including the outer brackets. It's OK, however it doesn't allow any additional flexibility - in your case, you needed to combine it with another filter for the field Ligne, and you couldn't do it without separating the two filters into two separate Set Analysis expressions.
If you modify your filter to only include the filter itself, then you could enclose multiple variables in the same Set Analysis expression, like this:
{< $(vFilter1), $(vFilter2), $(vFilter3) >}
So, I'd recommend to simplify your formula this way:
The filter variable (removing the outer brackets):
[Date de production]={">=$(=Max(Monthstart(AddMonths(Today(),-$(vNombreMois)+1))) ) <$(=Max(Addmonths(MonthEnd(Today()),0)))"}
The expression (using an outer Set that applies to the whole calculation):
{1<Ligne = $::Ligne, $(VFiltreMoisPrecedents)>}
sum( QuantiteReferences)
/
Sum(Total <[Date de production.autoCalendar.YearMonth]> QuantiteReferences)
Try it in your app and see if it produces the same results.
Cheers,


