Unlock a world of possibilities! Login now and discover the exclusive benefits awaiting you.
- Qlik Community
- :
- Forums
- :
- Analytics & AI
- :
- Products & Topics
- :
- App Development
- :
- Can i show Group of mesures in a same column ?
- Subscribe to RSS Feed
- Mark Topic as New
- Mark Topic as Read
- Float this Topic for Current User
- Bookmark
- Subscribe
- Mute
- Printer Friendly Page
- Mark as New
- Bookmark
- Subscribe
- Mute
- Subscribe to RSS Feed
- Permalink
- Report Inappropriate Content
Can i show Group of mesures in a same column ?
Hi everyone , i had some doubts about create Measure groups and show it in the same column.
Context:
I have 6 measures and two groups:
Real data:
- Sales
- Unit Price
- Quantity
Goals Data:
- Sales Goal
- Unit Price Goal
- Quantity Goal
and i want show and compare:
- Sales of Real Data with Sales Goals of Goals Data
- Unit Price of Real Data with Unit Price Goal of Goals Data
- Quantity of Real Data with Unit Quantity Goal of Goals Data
and optain for each one an indicator in the same line of each comparation in a pivot table
Eg:
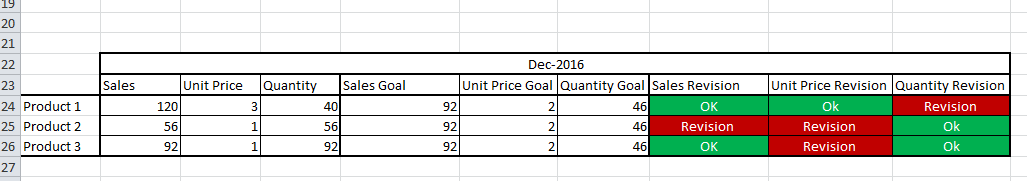
Actually i can only display the information at this way
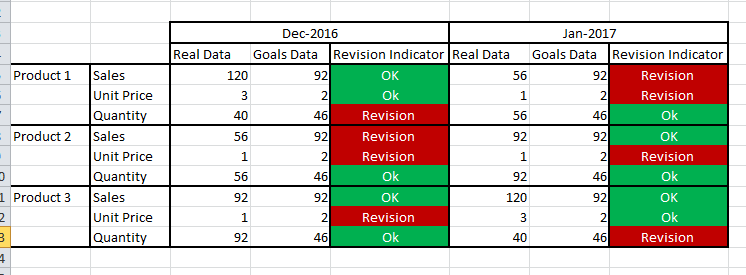
But i want show the information at this way
I tried differents ways but i fail.
It's possible do what i want natively ? or i need one extension o something ?
Thanks in advance,
Regards
- Mark as New
- Bookmark
- Subscribe
- Mute
- Subscribe to RSS Feed
- Permalink
- Report Inappropriate Content
i'm a qlikview user, we used to drag the column to the required place upward above the column or downward, but not sure this method will work and have you tried like this
- Mark as New
- Bookmark
- Subscribe
- Mute
- Subscribe to RSS Feed
- Permalink
- Report Inappropriate Content
Hi Taj,
I tried to do what you propose to me, but in Qlik Sense i can't do that.