Unlock a world of possibilities! Login now and discover the exclusive benefits awaiting you.

- Qlik Community
- :
- Forums
- :
- Analytics & AI
- :
- Products & Topics
- :
- App Development
- :
- Chart Aggr Problem
- Subscribe to RSS Feed
- Mark Topic as New
- Mark Topic as Read
- Float this Topic for Current User
- Bookmark
- Subscribe
- Mute
- Printer Friendly Page

 brunolovatti
- Mark as New
- Bookmark
- Subscribe
- Mute
- Subscribe to RSS Feed
- Permalink
- Report Inappropriate Content
Chart Aggr Problem
Hi!
I have this table:
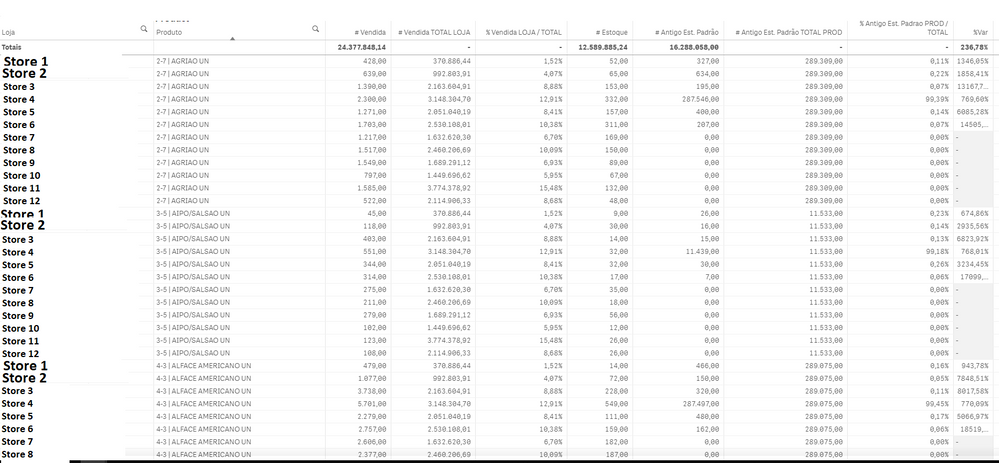
Where
1 Loja is the Store
2 Produto is the Product
3 # Vendida is the quantity sold
4 # Vendida TOTAL LOJA is the total quantity grouped by Loja
5 % Vendida Loja / Total is the total quantity sold of each Loja divided by Total Quantity Sold (24.377.848,14) - Means the participation of each Loja (store) from all sales (# Vendida)
6 # Estoque is the stock quantity
7 # Antigo Est. Padrão is the "default" stock quantity of each Loja should have
8 # Antigo Est. Padrão TOTAL PROD is the total of the prior column grouped by Produto
9 % Antigo Est. Padrão PROD / TOTAL is the value of # Antigo Est. Padrão divided by the Total grouped by Produto
10 %Var The difference between columns 5 and 9
The % Var column I calc like this:
if(value10 >= value5, (value10/value5)-1, (value5/value10)-1)
I did the table correctly using set analysis.
But I need a chart grouped by Loja counting each time the column 10 %Var is bigger than 5.
I got errors like "nested aggregation not allowed". So I changed every formula to use aggr instead and the table is correctly again. But I can not get the chart to work.
Column 4 formula:
aggr(nodistinct sum(all <Loja> if(Semana=0,QTD_VENDA,0)), Loja)
Column 5 formula:
aggr(nodistinct sum(all <Loja> if(Semana=0,QTD_VENDA,0)), Loja) / sum(all if(Semana=0,QTD_VENDA,0))
Column 8 formula:
aggr(nodistinct sum(all<Produto> if(Semana=0,QTD_EST_PADRAO_ANT,0)), Produto)
Column 9 formula:
sum(all <Loja,Produto> if(Semana=0,QTD_EST_PADRAO_ANT,0)) / aggr(nodistinct sum(all <Produto> if(Semana=0,QTD_EST_PADRAO_ANT,0)), Produto)
Column 10 formula:
if(
(aggr(nodistinct sum(all <Loja> if(Semana=0,QTD_VENDA,0)), Loja) / sum(all if(Semana=0,QTD_VENDA,0))) >=
(sum(all <Loja,Produto> if(Semana=0,QTD_EST_PADRAO_ANT,0))/aggr(nodistinct sum(all <Produto> if(Semana=0,QTD_EST_PADRAO_ANT,0)), Produto))
,
(aggr(nodistinct sum(all <Loja> if(Semana=0,QTD_VENDA,0)), Loja) / sum(all if(Semana=0,QTD_VENDA,0))) /
(sum(all <Loja,Produto> if(Semana=0,QTD_EST_PADRAO_ANT,0))/aggr(nodistinct sum(all <Produto> if(Semana=0,QTD_EST_PADRAO_ANT,0)), Produto))
,
(sum(all <Loja,Produto> if(Semana=0,QTD_EST_PADRAO_ANT,0))/aggr(nodistinct sum(all <Produto> if(Semana=0,QTD_EST_PADRAO_ANT,0)), Produto)) /
(aggr(nodistinct sum(all <Loja> if(Semana=0,QTD_VENDA,0)), Loja) / sum(all if(Semana=0,QTD_VENDA,0)))
)
How can I show a chart (pie) with only one dimension (Loja) and a metric showing the total number of times where the column 10 formula is greater than 5 (500%)?
I can send the qvf file if needed.
Thank you!
Bruno
