Unlock a world of possibilities! Login now and discover the exclusive benefits awaiting you.
- Qlik Community
- :
- Forums
- :
- Analytics & AI
- :
- Products & Topics
- :
- App Development
- :
- Color by dimension affecting the calculation on ch...
- Subscribe to RSS Feed
- Mark Topic as New
- Mark Topic as Read
- Float this Topic for Current User
- Bookmark
- Subscribe
- Mute
- Printer Friendly Page
- Mark as New
- Bookmark
- Subscribe
- Mute
- Subscribe to RSS Feed
- Permalink
- Report Inappropriate Content
Color by dimension affecting the calculation on chart: bug?
Hi!
I have a line chart to show market share evolution by YearMonth. It actually contains a variable that will change dimensions and measures depending on selections, but this issue only affects one of the cases that I will now expose.
Dimensions: YearMonth and Products
Measure: Market Share
Color: Auto -> Working fine!
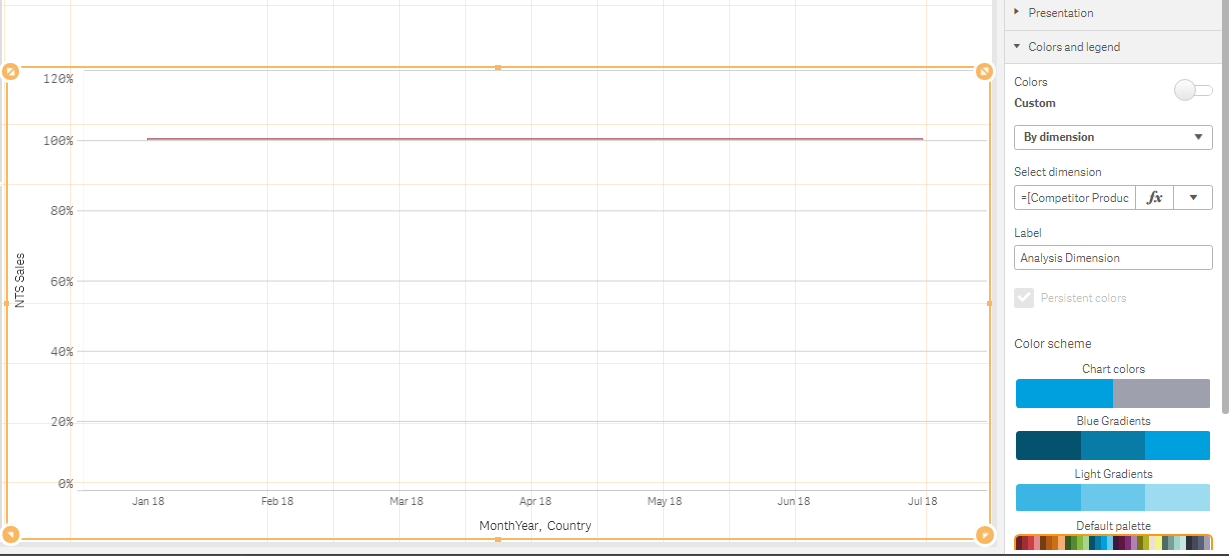
By Dimension = Product -> All the lines show 100%! 😮
How is it possible that by changing the color the calculation is different? This should never happen.
I'll add some screenshots hiding the legend values just to show you, color in auto mode shows correct values, color by dimension only shows 100% for all products.
Anyone encountered something similar? It really looks like a bug.
Thanks!
- Mark as New
- Bookmark
- Subscribe
- Mute
- Subscribe to RSS Feed
- Permalink
- Report Inappropriate Content
- Mark as New
- Bookmark
- Subscribe
- Mute
- Subscribe to RSS Feed
- Permalink
- Report Inappropriate Content
Hi Stalwar,
Don't think I can share it as it is client data and I'm not sure I will be able to reproduce the issue in a local environment, but the issue is as I show in the screenshots:
Select Automatic Colors -> The is one line per product, with different values between 0 and 100%
Select Colors by Product Dimension -> One single line is showed in the chart with a value of 100%
No other changes are done on the chart, just this.
- Mark as New
- Bookmark
- Subscribe
- Mute
- Subscribe to RSS Feed
- Permalink
- Report Inappropriate Content
New info after some investigation.
This is working fine in a Qlik desktop, February release.
Server release was updated a few days ago to the latest version.
It's looking even more like a bug of the new release...
- Mark as New
- Bookmark
- Subscribe
- Mute
- Subscribe to RSS Feed
- Permalink
- Report Inappropriate Content
I'm also encountering this issue... ☹️