Unlock a world of possibilities! Login now and discover the exclusive benefits awaiting you.
- Qlik Community
- :
- Forums
- :
- Analytics & AI
- :
- Products & Topics
- :
- App Development
- :
- Re: Colouring a Bar Chart
- Subscribe to RSS Feed
- Mark Topic as New
- Mark Topic as Read
- Float this Topic for Current User
- Bookmark
- Subscribe
- Mute
- Printer Friendly Page
- Mark as New
- Bookmark
- Subscribe
- Mute
- Subscribe to RSS Feed
- Permalink
- Report Inappropriate Content
Colouring a Bar Chart
I have a bar chart where the dimension is 'ENPS' (a number scale form 0-10) and two measures which count the number scores for this week and for last week;
count(if(weekstart(today()-1)=weekstart(Feedback_Day_Start),ENPS)) for 'this week'
count(if(weekstart(today()-8)=weekstart(Feedback_Day_Start),ENPS)) for 'last week'
Does anyone have an expression that would enable me to change the colours of the two bars.
I thought if(weekstart(today()-1)=weekstart(Feedback_Day_Start),rgb(10,174,255)) would colour the 'this week' bar and leave the other grey but it didnt work,
Thanks
Accepted Solutions
- Mark as New
- Bookmark
- Subscribe
- Mute
- Subscribe to RSS Feed
- Permalink
- Report Inappropriate Content
Create ur 2 measures as master measures; and there u can assign a color to each measure.
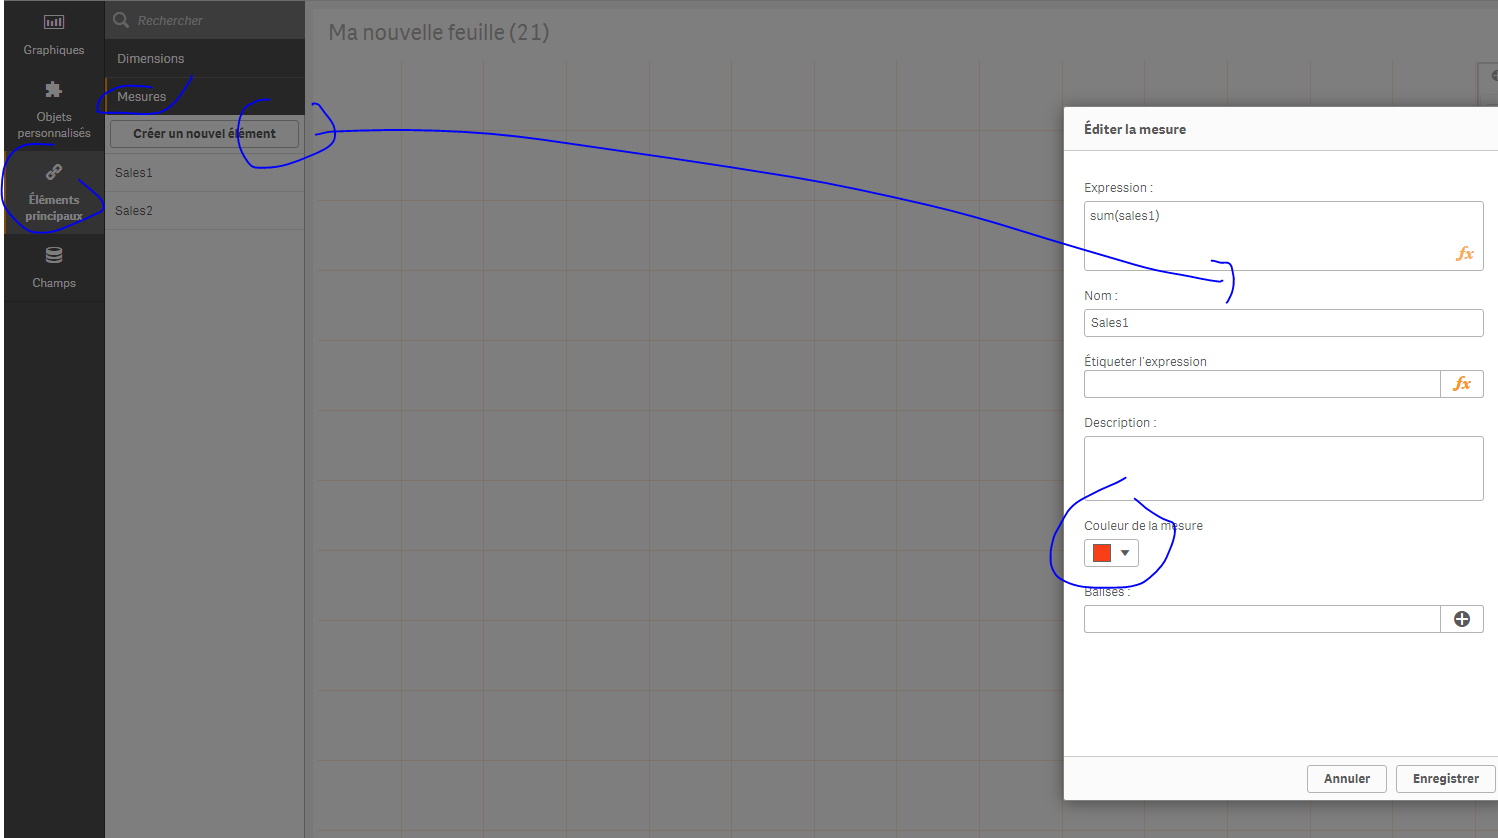
In ur chart, use the newly created master measure and they'll be colored the way u want them to be
- Mark as New
- Bookmark
- Subscribe
- Mute
- Subscribe to RSS Feed
- Permalink
- Report Inappropriate Content
May be omarbensalem can help here
- Mark as New
- Bookmark
- Subscribe
- Mute
- Subscribe to RSS Feed
- Permalink
- Report Inappropriate Content
Create ur 2 measures as master measures; and there u can assign a color to each measure.
In ur chart, use the newly created master measure and they'll be colored the way u want them to be
- Mark as New
- Bookmark
- Subscribe
- Mute
- Subscribe to RSS Feed
- Permalink
- Report Inappropriate Content
Thank you both. This works well