Unlock a world of possibilities! Login now and discover the exclusive benefits awaiting you.
- Qlik Community
- :
- Forums
- :
- Analytics & AI
- :
- Products & Topics
- :
- App Development
- :
- Complex linear forecasting
- Subscribe to RSS Feed
- Mark Topic as New
- Mark Topic as Read
- Float this Topic for Current User
- Bookmark
- Subscribe
- Mute
- Printer Friendly Page
- Mark as New
- Bookmark
- Subscribe
- Mute
- Subscribe to RSS Feed
- Permalink
- Report Inappropriate Content
Complex linear forecasting
Hi,
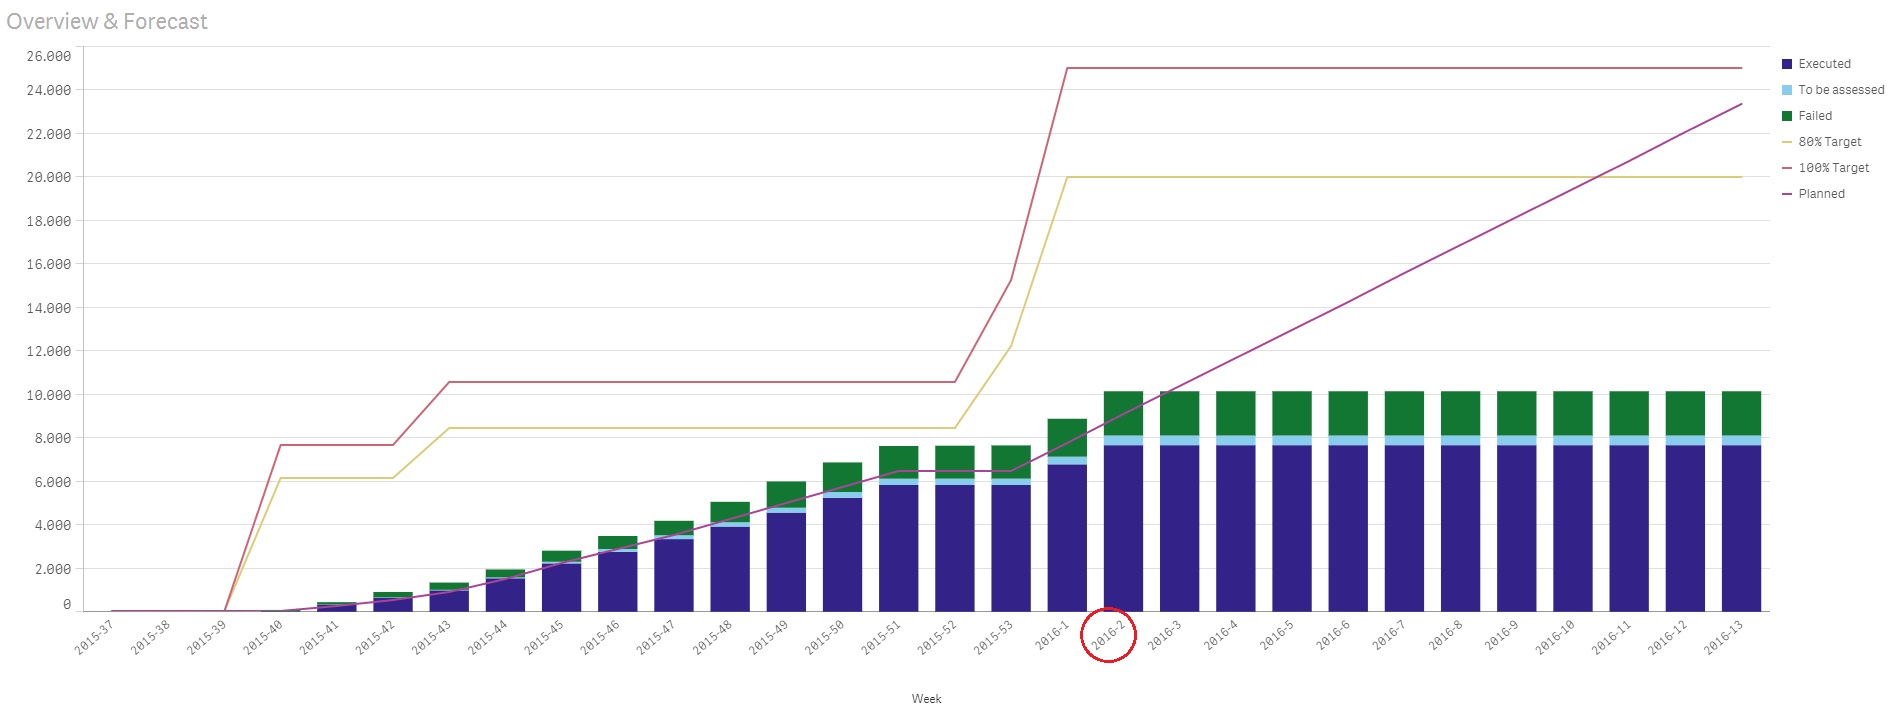
I am trying to calculate a forecast based on orders that were ‘executed’ in the past. I attached my current visualization with the dimension ‘Week’ on the x-axis and six different measurements on the y-axis. All measurements accumulate with: Rangesum( Above( Count( [dimension], 0 , RowNo())).

The x-axis starts at 2015-37 and ends at 2016-13 based on the weeks for which orders were ‘Planned’. Week 2016-2 was the last week in which orders were handled, which is why the bar charts don’t accumulate any further from that point onwards. Also, as can be seen in the visualization, during week 2015-52 and 2015-53 no orders were handled.
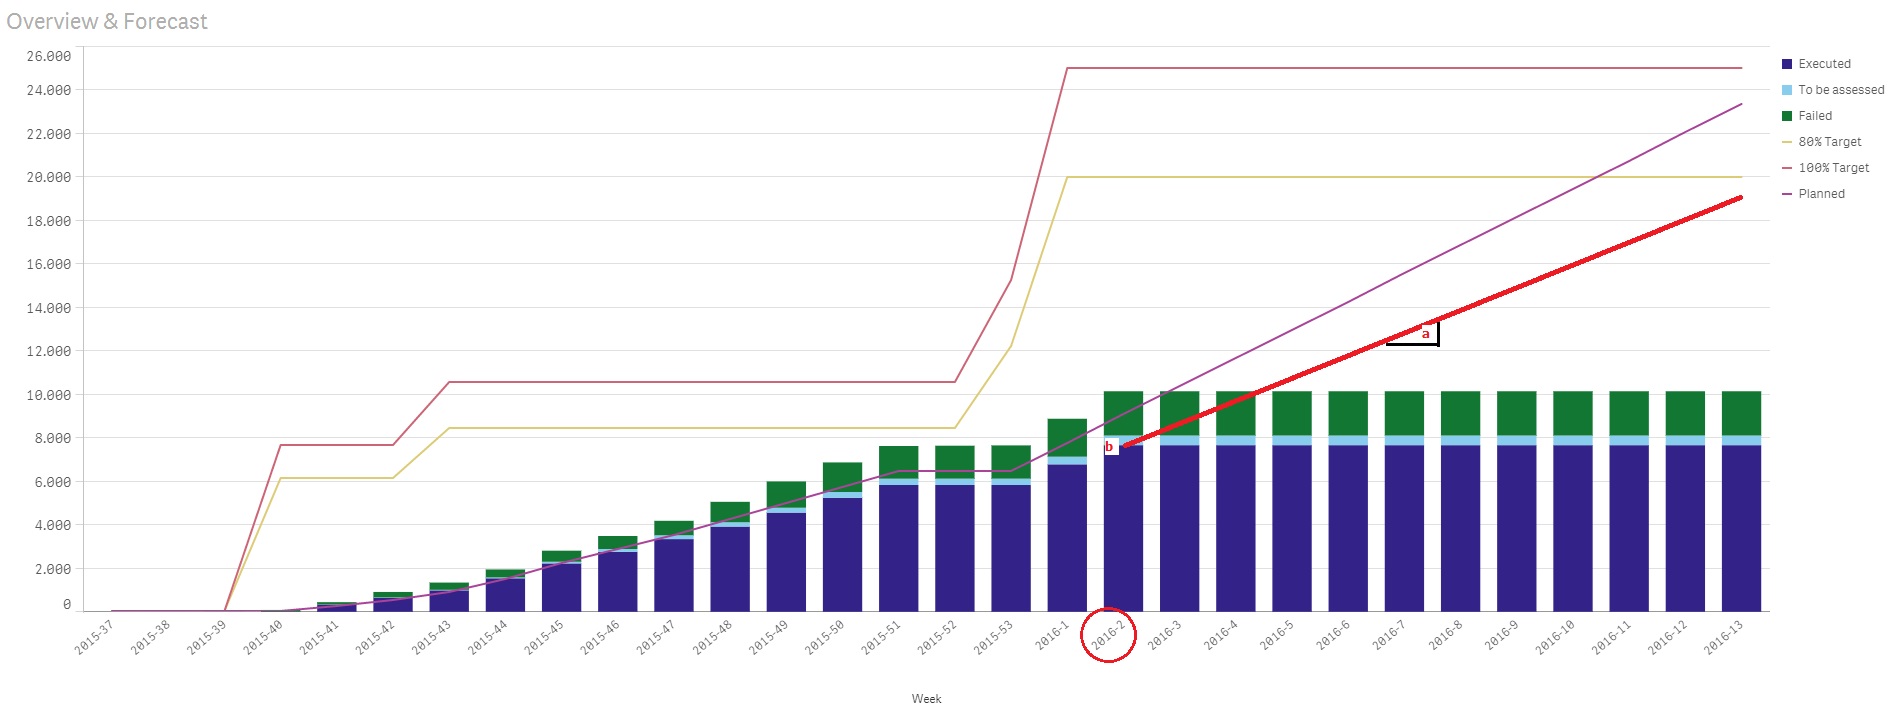
What I would like to do now, is develop a linear forecast line based on the average number of ‘Executed’ orders from the last 4 weeks during which more than 10 orders were actually ‘Executed’.
For instance, the forecast line should start at week 2016-2 and linearly continue until the end of ‘Planned’ (2016-13). Because there were less than 10 executed orders in week 2015-52 and 2015-53, those weeks should be excluded in the average. The result should become a line y=ax+b with (in this example):
- b = amount of executed orders in week 2016-2
- a = average of executed orders in week 2016-2, 2016-1, 2015-51 and 2015-50
- with x = 1 for the current week, 2 for the coming week, etc.

In addition, above orders are linked to a specific region. Each region has a starting and an end date. For example, during week 2015-53 and 2016-1 several regions have been added and as a result the 100% Target, 80% Target, and Planning rise to a new level.
Below the chart, there has to be a filter on region. Using this filter now, all measurements adapt accordingly. The forecast also has to comply with such a selection.
My guess is that the solution lies in using LINEST_M + LINEST_B, but I cannot seem to solve this issue. Could someone please advise? Thank you in advance.
Kind regards,
Julian