Unlock a world of possibilities! Login now and discover the exclusive benefits awaiting you.
- Qlik Community
- :
- Forums
- :
- Analytics & AI
- :
- Products & Topics
- :
- App Development
- :
- Re: Count by hours??
- Subscribe to RSS Feed
- Mark Topic as New
- Mark Topic as Read
- Float this Topic for Current User
- Bookmark
- Subscribe
- Mute
- Printer Friendly Page
- Mark as New
- Bookmark
- Subscribe
- Mute
- Subscribe to RSS Feed
- Permalink
- Report Inappropriate Content
Count by hours??
Hi All,
I have a requirement where i need to put a chart like Count and Sum by only hour irrespective of date, example below
01/02/2014 00:12:25
01/02/2014 00:30:29
02/02/2014 01:40:25
05/02/2014 01:18:25
03/02/2014 02:13:25
09/02/2014 02:16:25
25/02/2014 02:54:25
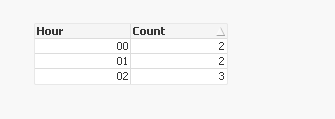
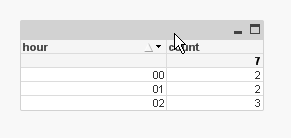
so when i take count, the output should be below
hour count
00 2
01 2
02 3
so please help me achieving this!!
- Mark as New
- Bookmark
- Subscribe
- Mute
- Subscribe to RSS Feed
- Permalink
- Report Inappropriate Content
The easiest way would be to create a new field in the load script called "hour".
You can easily use the Hour() function to achieve this.
eg, if DateTime is your existing field, something like this would then allow a count to be preformed on the new "hour" field.
LOAD
DateTime,
Hour(DateTime) as hour
FROM...
You can then easily create a bar chart for example of hour by count(hour).
I've attached a very simple example with your data.
- Mark as New
- Bookmark
- Subscribe
- Mute
- Subscribe to RSS Feed
- Permalink
- Report Inappropriate Content
Hi,
Have a look at the attached file.
Hope it helps!
Kiru
- Mark as New
- Bookmark
- Subscribe
- Mute
- Subscribe to RSS Feed
- Permalink
- Report Inappropriate Content
Hi,
Hope it helps !
Load
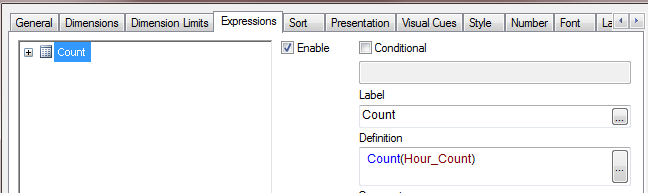
mid(field_date,12,2) as Hour,
hour(field_date) as Hour_Count
From....
- Mark as New
- Bookmark
- Subscribe
- Mute
- Subscribe to RSS Feed
- Permalink
- Report Inappropriate Content
use a calculated dimension, if your field is datetime
=time(floor(frac(datetime),1/24), 'hh')
expression
=count(datetime)
- Mark as New
- Bookmark
- Subscribe
- Mute
- Subscribe to RSS Feed
- Permalink
- Report Inappropriate Content
Hi Shrihari,
Your requirement for count and sum of hour,it's unclear.
if you want to count of how many hours an work is done.
you need to take a max hour of each day and sum it.
then you might achieve the requirement you need.
Nitha
- Mark as New
- Bookmark
- Subscribe
- Mute
- Subscribe to RSS Feed
- Permalink
- Report Inappropriate Content
Hi Shrihari J, could you please confirm if this is a Qlik Sense or QlikView problem they are having?
This has been posted in the Qlik Sense forum, however a couple of these suggestions are relating to QlikView.
- Mark as New
- Bookmark
- Subscribe
- Mute
- Subscribe to RSS Feed
- Permalink
- Report Inappropriate Content
Thank you all for the replies. used 'Hour(datetime) as Hour' while loading, its working fine.