Unlock a world of possibilities! Login now and discover the exclusive benefits awaiting you.
- Qlik Community
- :
- Forums
- :
- Analytics & AI
- :
- Products & Topics
- :
- App Development
- :
- Re: Count number of old/new ID
- Subscribe to RSS Feed
- Mark Topic as New
- Mark Topic as Read
- Float this Topic for Current User
- Bookmark
- Subscribe
- Mute
- Printer Friendly Page
- Mark as New
- Bookmark
- Subscribe
- Mute
- Subscribe to RSS Feed
- Permalink
- Report Inappropriate Content
Count number of old/new ID
Hi Qlikers,
I would like to calculate how many old/new ID I have between two dates. What I tried is :
count(distinct(if(Extract_Date = 'MAX DATE', ID)) - count(distinct(if(Extract_Date = 'MIN DATE', ID)) . But this doesn't work for a table like this :
| MIN DATE | A | count(distinct(if(Extract_Date = MIN 'DATE', ID)) = 8 |
| MIN DATE | B | |
| MIN DATE | C | |
| MIN DATE | D | |
| MIN DATE | E | |
| MIN DATE | F | |
| MIN DATE | G | |
| MIN DATE | H | |
| MAX DATE | A | count(distinct(if(Extract_Date = MAX 'DATE', ID)) = 6 |
| MAX DATE | B | |
| MAX DATE | C | |
| MAX DATE | I | |
| MAX DATE | J | |
| MAX DATE | K |
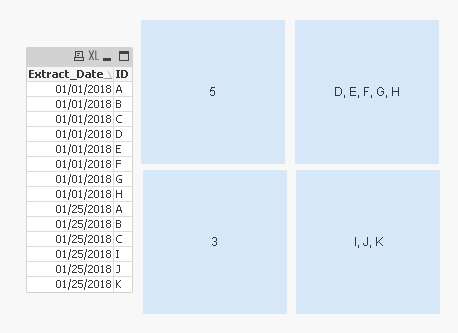
The result I would like is to find 5 old ID (D,E,F,G,H) in my MIN DATE and 3 new ID (I,J,K) in my MAX DATE. If someone has and idea without doing anything in the script. Just in the visualisation console.
Thanks for your help
- « Previous Replies
-
- 1
- 2
- Next Replies »
Accepted Solutions
- Mark as New
- Bookmark
- Subscribe
- Mute
- Subscribe to RSS Feed
- Permalink
- Report Inappropriate Content
I will share the expressions
=Count({<ID = p({<Extract_Date = {"$(=Date(Min(Extract_Date)))"}>})*e({<Extract_Date = {"$(=Date(Max(Extract_Date)))"}>})>}ID)
=Concat({<ID = p({<Extract_Date = {"$(=Date(Min(Extract_Date)))"}>})*e({<Extract_Date = {"$(=Date(Max(Extract_Date)))"}>})>}ID, ', ')
=Count({<ID = p({<Extract_Date = {"$(=Date(Max(Extract_Date)))"}>})*e({<Extract_Date = {"$(=Date(Min(Extract_Date)))"}>})>}ID)
=Concat({<ID = p({<Extract_Date = {"$(=Date(Max(Extract_Date)))"}>})*e({<Extract_Date = {"$(=Date(Min(Extract_Date)))"}>})>}ID, ', ')
- Mark as New
- Bookmark
- Subscribe
- Mute
- Subscribe to RSS Feed
- Permalink
- Report Inappropriate Content
Is Extract_Date a true date field on is it just MIN_DATE and MAX_DATE?
- Mark as New
- Bookmark
- Subscribe
- Mute
- Subscribe to RSS Feed
- Permalink
- Report Inappropriate Content
Hi,
It's a true date : in fact i'm using variable : Extract_Date = date('$(vMinDate)')
- Mark as New
- Bookmark
- Subscribe
- Mute
- Subscribe to RSS Feed
- Permalink
- Report Inappropriate Content
So between the two dates selected, you would want to know what are ids which stop appearing and ids which came up new?
- Mark as New
- Bookmark
- Subscribe
- Mute
- Subscribe to RSS Feed
- Permalink
- Report Inappropriate Content
Check attached
- Mark as New
- Bookmark
- Subscribe
- Mute
- Subscribe to RSS Feed
- Permalink
- Report Inappropriate Content
Yes that exactly what I want !
- Mark as New
- Bookmark
- Subscribe
- Mute
- Subscribe to RSS Feed
- Permalink
- Report Inappropriate Content
I'm using Qlik Sense and .qvw doesn't show me any visualisation. I only see the script.
- Mark as New
- Bookmark
- Subscribe
- Mute
- Subscribe to RSS Feed
- Permalink
- Report Inappropriate Content
I will share the expressions
=Count({<ID = p({<Extract_Date = {"$(=Date(Min(Extract_Date)))"}>})*e({<Extract_Date = {"$(=Date(Max(Extract_Date)))"}>})>}ID)
=Concat({<ID = p({<Extract_Date = {"$(=Date(Min(Extract_Date)))"}>})*e({<Extract_Date = {"$(=Date(Max(Extract_Date)))"}>})>}ID, ', ')
=Count({<ID = p({<Extract_Date = {"$(=Date(Max(Extract_Date)))"}>})*e({<Extract_Date = {"$(=Date(Min(Extract_Date)))"}>})>}ID)
=Concat({<ID = p({<Extract_Date = {"$(=Date(Max(Extract_Date)))"}>})*e({<Extract_Date = {"$(=Date(Min(Extract_Date)))"}>})>}ID, ', ')
- Mark as New
- Bookmark
- Subscribe
- Mute
- Subscribe to RSS Feed
- Permalink
- Report Inappropriate Content
shared the expressions I used 
- Mark as New
- Bookmark
- Subscribe
- Mute
- Subscribe to RSS Feed
- Permalink
- Report Inappropriate Content
Splendid !! I would never have found. Is it possible to hire you or invite you for some advance training on Qlik Script and Visualisation Expression ?
- « Previous Replies
-
- 1
- 2
- Next Replies »