Unlock a world of possibilities! Login now and discover the exclusive benefits awaiting you.

Announcements
Want to see what's currently in public preview? We've pulled it all together in one place. Check it out here
- Qlik Community
- :
- Forums
- :
- Analytics & AI
- :
- Products & Topics
- :
- App Development
- :
- Creating Graphs with dimensions and dates?
Options
- Subscribe to RSS Feed
- Mark Topic as New
- Mark Topic as Read
- Float this Topic for Current User
- Bookmark
- Subscribe
- Mute
- Printer Friendly Page
Turn on suggestions
Auto-suggest helps you quickly narrow down your search results by suggesting possible matches as you type.
Showing results for

Not applicable
2017-04-18
05:27 AM
- Mark as New
- Bookmark
- Subscribe
- Mute
- Subscribe to RSS Feed
- Permalink
- Report Inappropriate Content
Creating Graphs with dimensions and dates?
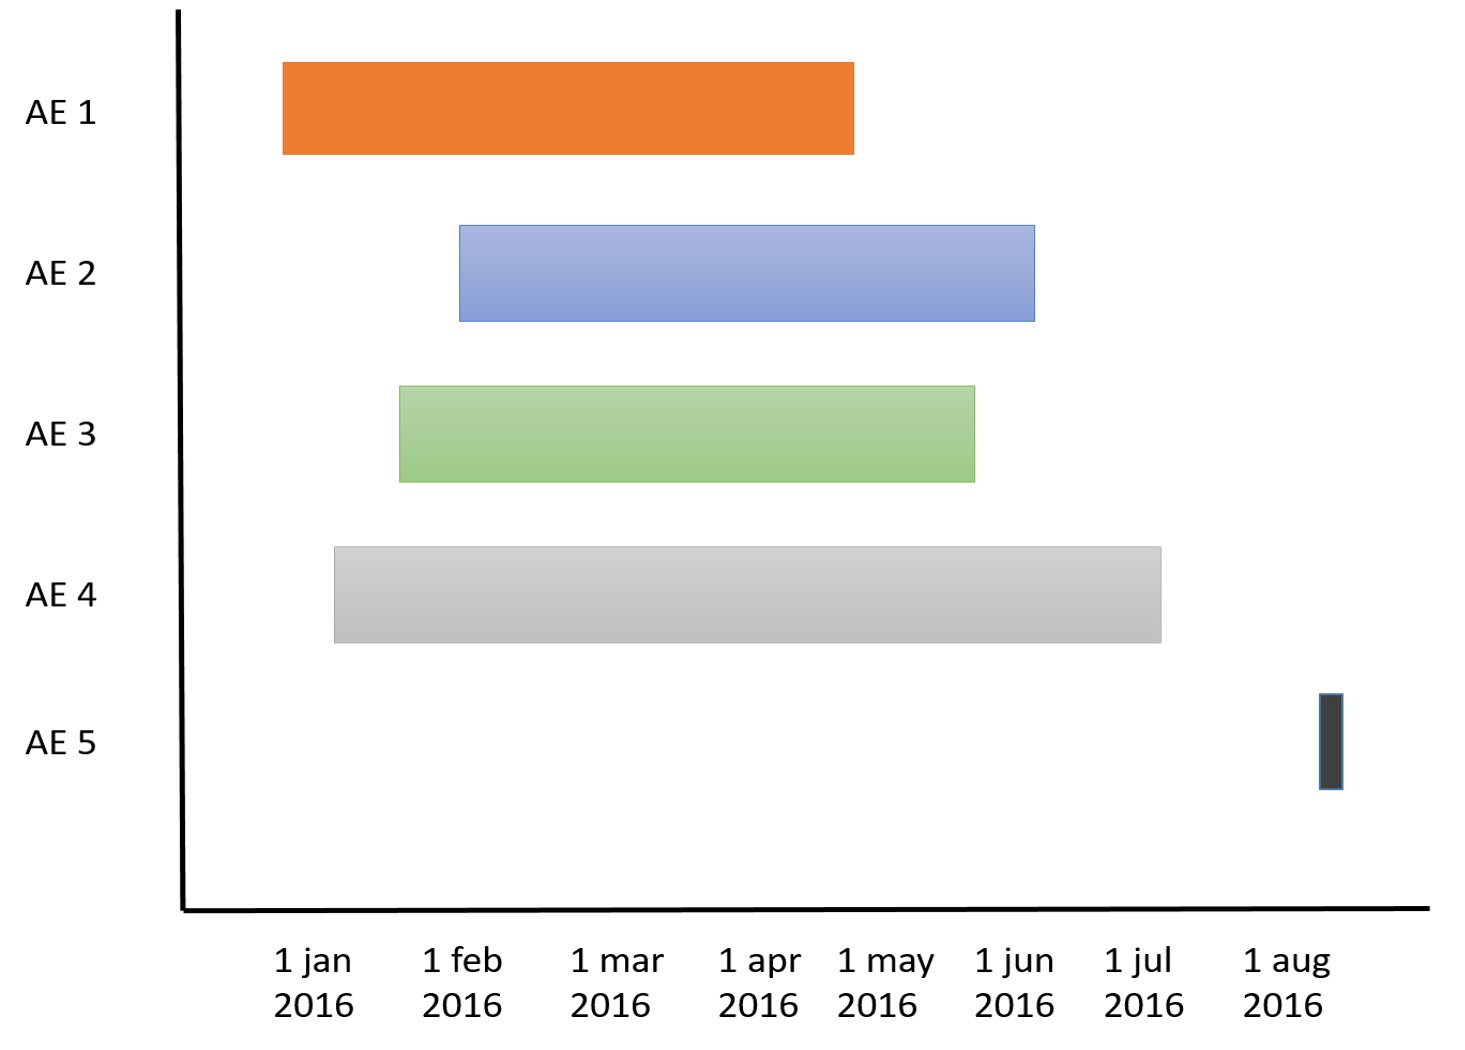
I want to develop a visualization that could display dimensions which have a start and stop date in a bar or box graph. Is it possible to do the same in Qlik sense? Attached is an example for the same.
734 Views
1 Reply
Anonymous
Not applicable
2017-04-18
01:21 PM
Author
- Mark as New
- Bookmark
- Subscribe
- Mute
- Subscribe to RSS Feed
- Permalink
- Report Inappropriate Content
You might have a look at the Timeline extension available in Qlik Branch.
687 Views