Unlock a world of possibilities! Login now and discover the exclusive benefits awaiting you.
- Qlik Community
- :
- Forums
- :
- Analytics & AI
- :
- Products & Topics
- :
- App Development
- :
- Cumulative Metric
- Subscribe to RSS Feed
- Mark Topic as New
- Mark Topic as Read
- Float this Topic for Current User
- Bookmark
- Subscribe
- Mute
- Printer Friendly Page
- Mark as New
- Bookmark
- Subscribe
- Mute
- Subscribe to RSS Feed
- Permalink
- Report Inappropriate Content
Cumulative Metric
Hi everyone,
I am building a cumulative metric in Qlik Sense that needs to be calculated by Material and Expiration Date.
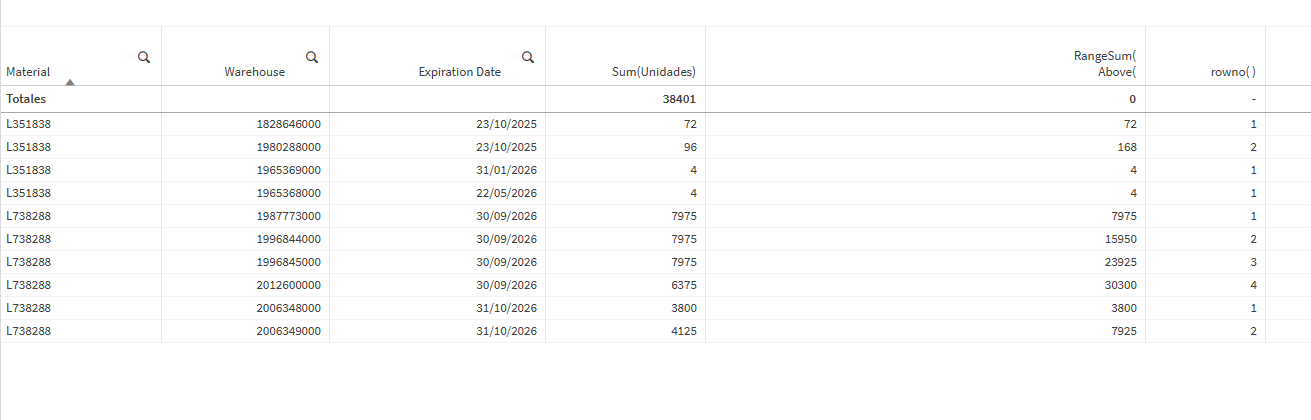
The requirement is that the calculation should accumulate correctly by Material and Expiration Date, but without the Warehouse field resetting the accumulation. In addition, this accumulation should be performed for each Material in ascending order of Expiration Date.
I have tried using a RangeSum(Above(...)) over the metric to be accumulated, as well as over an Aggr() of that metric:
RangeSum(Above(Sum(Unidades), 0, RowNo()))
or
RangeSum(Above(Aggr(Sum(Unidades), Material, ExpirationDate), 0, RowNo()))
If I remove the Warehouse field from the table, the accumulation works correctly, but then I lose the Warehouse detail.
I cannot get the RangeSum to only respect Material + Expiration Date as the main grouping, while ignoring Warehouse.

As shown in the image, the RowNo() does not behave as expected for this accumulation. The metric should keep accumulating the values of the 4th column up to the fourth row and, on the fifth row, reset and start summing the accumulated Units for the next Material.
Does anyone know how to force RangeSum() to group only by Material + Expiration Date, ignoring Warehouse, while still keeping Warehouse in the table?
Thanks a lot in advance!
- Mark as New
- Bookmark
- Subscribe
- Mute
- Subscribe to RSS Feed
- Permalink
- Report Inappropriate Content
@Fran12 AES Success wrote:
Hi everyone,
I am building a cumulative metric in Qlik Sense that needs to be calculated by Material and Expiration Date.
The requirement is that the calculation should accumulate correctly by Material and Expiration Date, but without the Warehouse field resetting the accumulation. In addition, this accumulation should be performed for each Material in ascending order of Expiration Date.
I have tried using a RangeSum(Above(...)) over the metric to be accumulated, as well as over an Aggr() of that metric:
RangeSum(Above(Sum(Unidades), 0, RowNo()))
or
RangeSum(Above(Aggr(Sum(Unidades), Material, ExpirationDate), 0, RowNo()))
If I remove the Warehouse field from the table, the accumulation works correctly, but then I lose the Warehouse detail.
I cannot get the RangeSum to only respect Material + Expiration Date as the main grouping, while ignoring Warehouse.
As shown in the image, the RowNo() does not behave as expected for this accumulation. The metric should keep accumulating the values of the 4th column up to the fourth row and, on the fifth row, reset and start summing the accumulated Units for the next Material.
Does anyone know how to force RangeSum() to group only by Material + Expiration Date, ignoring Warehouse, while still keeping Warehouse in the table?
Thanks a lot in advance!
Hello @Fran12,
Use this expression:
```qlik
RangeSum(
Above(
Sum(Unidades),
0,
RowNo(TOTAL)
)
)
```
Then wrap it in an `Aggr()` like this:
```qlik
Aggr(
RangeSum(
Above(
Sum(Unidades),
0,
RowNo(TOTAL)
)
),
Material,
ExpirationDate
)
```
This ensures accumulation by `Material + ExpirationDate`, ignoring `Warehouse`, while keeping Warehouse in the table. Use `RowNo(TOTAL)` to prevent resets caused by extra dimensions.
Best Regards,
James Patton
- Mark as New
- Bookmark
- Subscribe
- Mute
- Subscribe to RSS Feed
- Permalink
- Report Inappropriate Content
The problem with that metric is that it doesn’t add up record by record the value of each cumulative. The formula you mention looks like this:

And I want it to accumulate in each record and only reset when we switch to a different Material.
Thanks a lot
- Mark as New
- Bookmark
- Subscribe
- Mute
- Subscribe to RSS Feed
- Permalink
- Report Inappropriate Content
The specification sounds like something one would create in Excel spreadsheets and then wants it in Qlik. Anyways, it might be useful to take a look into Chart level scripting . Using this feature you can access the hypercube and modify it, create new rows etc.