Unlock a world of possibilities! Login now and discover the exclusive benefits awaiting you.
- Qlik Community
- :
- Forums
- :
- Analytics
- :
- App Development
- :
- Cumulative value of rolling 12 months
- Subscribe to RSS Feed
- Mark Topic as New
- Mark Topic as Read
- Float this Topic for Current User
- Bookmark
- Subscribe
- Mute
- Printer Friendly Page
- Mark as New
- Bookmark
- Subscribe
- Mute
- Subscribe to RSS Feed
- Permalink
- Report Inappropriate Content
Cumulative value of rolling 12 months
Hello Experts!!,
I need to show the value of a month, and the value of the rolling 12 of this month in Qlik Sense.
Sample data:
Data:
LOAD
Date(D) as D
,DateNum
,Value
;
LOAD * INLINE [
D | DateNum | Value
01/09/2014 | 41883 | 81.721,40
01/10/2014 | 41913 | 87.481,20
01/11/2014 | 41944 | 75.499,00
01/12/2014 | 41974 | 80.794,50
01/01/2015 | 42005 | 83.687,40
01/02/2015 | 42036 | 84.260,40
01/03/2015 | 42064 | 92.112,50
01/04/2015 | 42095 | 89.557,40
01/05/2015 | 42125 | 88.138,70
01/06/2015 | 42156 | 96.974,30
01/07/2015 | 42186 | 102.522,20
01/08/2015 | 42217 | 96.040,30
01/09/2015 | 42248 | 106.034,20
01/10/2015 | 42278 | 107.147,90
01/11/2015 | 42309 | 107.078,30
01/12/2015 | 42339 | 107.308,90
01/01/2016 | 42370 | 100.684,60
01/02/2016 | 42401 | 110.935,50
01/03/2016 | 42430 | 113.167,40
01/04/2016 | 42461 | 111.773,50
01/05/2016 | 42491 | 108.695,60
01/06/2016 | 42522 | 116.286,00
01/07/2016 | 42552 | 104.033,20
01/08/2016 | 42583 | 112.373,00
01/09/2016 | 42614 | 120.217,80
01/10/2016 | 42644 | 112.347,90
01/11/2016 | 42675 | 118.047,40
01/12/2016 | 42705 | 112.572,70
01/01/2017 | 42736 | 124.785,10
01/02/2017 | 42767 | 121.136,10
01/03/2017 | 42795 | 138.467,30
01/04/2017 | 42826 | 113.138,00
01/05/2017 | 42856 | 129.866,40
01/06/2017 | 42887 | 138.104,90
01/07/2017 | 42917 | 123.780,40
01/08/2017 | 42948 | 100.913,90
] (delimiter is '|') ;
Note: Dateformat is 'DD/MM/YYYY'
For example, in April/2017 (01/04/2017 or 42826) it would show the sum of May/2016 until April/2017.
I get the correct output with this formula :
sum({<D = {">$(=AddMonths(makedate(2017,4), -12))<=$(=makedate(2017,4))"}>}Value)
But, in a table, when I replace the makedate with the dimension D, it shows nothing.
The original data has more fields (Customer, Country, Seller....) and I'd like to use it with aggr, selections, filters...
I've been trying to create an AsOf table, but I'm not sure if it will be a efficient solution.
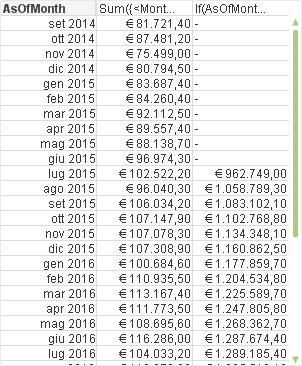
This would be the desired output:
| Date | Value | Cumulative R12 |
|---|---|---|
| 01/09/2014 | 81.721,40 | |
| 01/10/2014 | 87.481,20 | |
| 01/11/2014 | 75.499,00 | |
| 01/12/2014 | 80.794,50 | |
| 01/01/2015 | 83.687,40 | |
| 01/02/2015 | 84.260,40 | |
| 01/03/2015 | 92.112,50 | |
| 01/04/2015 | 89.557,40 | |
| 01/05/2015 | 88.138,70 | |
| 01/06/2015 | 96.974,30 | |
| 01/07/2015 | 102.522,20 | 962.749,00 |
| 01/08/2015 | 96.040,30 | 1.058.789,30 |
| 01/09/2015 | 106.034,20 | 1.083.102,10 |
| 01/10/2015 | 107.147,90 | 1.102.768,80 |
| 01/11/2015 | 107.078,30 | 1.134.348,10 |
| 01/12/2015 | 107.308,90 | 1.160.862,50 |
01/01/2016 | 100.684,60 | 1.177.859,70 |
| 01/02/2016 | 110.935,50 | 1.204.534,80 |
| 01/03/2016 | 113.167,40 | 1.225.589,70 |
| 01/04/2016 | 111.773,50 | 1.247.805,80 |
| 01/05/2016 | 108.695,60 | 1.268.362,70 |
| 01/06/2016 | 116.286,00 | 1.287.674,40 |
| 01/07/2016 | 104.033,20 | 1.289.185,40 |
| 01/08/2016 | 112.373,00 | 1.305.518,10 |
| 01/09/2016 | 120.217,80 | 1.319.701,70 |
| 01/10/2016 | 112.347,90 | 1.324.901,70 |
| 01/11/2016 | 118.047,40 | 1.335.870,80 |
| 01/12/2016 | 112.572,70 | 1.341.134,60 |
| 01/01/2017 | 124.785,10 | 1.365.235,10 |
| 01/02/2017 | 121.136,10 | 1.375.435,70 |
| 01/03/2017 | 138.467,30 | 1.400.735,60 |
| 01/04/2017 | 113.138,00 | 1.402.100,10 |
| 01/05/2017 | 129.866,40 | 1.423.270,90 |
| 01/06/2017 | 138.104,90 | 1.445.089,80 |
| 01/07/2017 | 123.780,40 | 1.464.837,00 |
| 01/08/2017 | 100.913,90 | 1.453.377,90 |
Thanks in advance!
Accepted Solutions
- Mark as New
- Bookmark
- Subscribe
- Mute
- Subscribe to RSS Feed
- Permalink
- Report Inappropriate Content
Attachment Sense Version
- Mark as New
- Bookmark
- Subscribe
- Mute
- Subscribe to RSS Feed
- Permalink
- Report Inappropriate Content
Hi Victor,
You need AsOf Table.
See Attachment.
Regards,
Antonio

- Mark as New
- Bookmark
- Subscribe
- Mute
- Subscribe to RSS Feed
- Permalink
- Report Inappropriate Content
Attachment Sense Version
- Mark as New
- Bookmark
- Subscribe
- Mute
- Subscribe to RSS Feed
- Permalink
- Report Inappropriate Content
Without AsOf Table
try this in Expression
If(RowNo() > 10, RangeSum(Top(Sum(Value),RowNo()-10,Rowno())))

- Mark as New
- Bookmark
- Subscribe
- Mute
- Subscribe to RSS Feed
- Permalink
- Report Inappropriate Content
Thank you very much, antoniotiman.
This is was I looking for.
I was doing something wrong.
Thanks again!
- Mark as New
- Bookmark
- Subscribe
- Mute
- Subscribe to RSS Feed
- Permalink
- Report Inappropriate Content
Thanks for your answer, but the values doesn't match with de desired output.
I'll try the AsOf table but I'll take a look at your example.
Thanks again!