Unlock a world of possibilities! Login now and discover the exclusive benefits awaiting you.
- Qlik Community
- :
- Forums
- :
- Analytics & AI
- :
- Products & Topics
- :
- App Development
- :
- Data Profiling across Fields
- Subscribe to RSS Feed
- Mark Topic as New
- Mark Topic as Read
- Float this Topic for Current User
- Bookmark
- Subscribe
- Mute
- Printer Friendly Page
- Mark as New
- Bookmark
- Subscribe
- Mute
- Subscribe to RSS Feed
- Permalink
- Report Inappropriate Content
Data Profiling across Fields
Hello
I recently found this blog post in regards to Data Profiling with QLik
https://www.quickintelligence.co.uk/qlikview-data-profiler/#comment-1056714
It leverages the system fields $Field & $Table to allow you to review data of each column in your model.
One of the calculation you are able to do is to get number of NULLS present in a single field.
This is done using this calculation:
sum(if(isnull( [$(=minstring($Field))]), 1, 0)) // Number of NULL values
I have been trying to replicate this but across columns ex:
Number of Null Values across multiple fields(or multiple tables)
Number of Blank Values across multiple fields(or multiple tables)
i have tried a combination of Pivot charts and also using the Agrr function to iterate over the fields and apply the same calculation but it is not working.
Ex:
sum
(
Aggr
(
sum(if(isnull( [$(=minstring($Field))]), 1, 0)) // Number of NULL values
,$Field
)
)
Any help on how to do this would be great
- Mark as New
- Bookmark
- Subscribe
- Mute
- Subscribe to RSS Feed
- Permalink
- Report Inappropriate Content
Hi,
I'm afraid this is not possible in a chart,
as you notice in this blog you select one field in $Field.
in a chart with $field as dimension: $ expansion $(= xxxxx($Field)xxxx) can't work
so you can do this in the script and calculate for all fields, but not dinamically in front end by a chart
regards
- Mark as New
- Bookmark
- Subscribe
- Mute
- Subscribe to RSS Feed
- Permalink
- Report Inappropriate Content
okay i am not sure why it does not work on chart level though, but will look more into that.
Regarding doing the calculation in the script level, from what i read the $Field, and other system fields are not accessible at the script level am i mistaken on that ?
- Mark as New
- Bookmark
- Subscribe
- Mute
- Subscribe to RSS Feed
- Permalink
- Report Inappropriate Content
I used to write something like that in script to work on data model and acces table and field name :
for itable = 0 to NoOfTables()-1;
let vTable = TableName(itable);
for ifield= 1 to NoOfFields(vTable) ;
let vField = FieldName(ifield,tableName(itable));
................;
next
next
- Mark as New
- Bookmark
- Subscribe
- Mute
- Subscribe to RSS Feed
- Permalink
- Report Inappropriate Content
it's for qlikview,
I couldn't say for Q sense
- Mark as New
- Bookmark
- Subscribe
- Mute
- Subscribe to RSS Feed
- Permalink
- Report Inappropriate Content
You're right that $Field and it's siblings aren't available in script only in the running app.
Have you considered using NullCount() and the other similar count functions instead.
- Mark as New
- Bookmark
- Subscribe
- Mute
- Subscribe to RSS Feed
- Permalink
- Report Inappropriate Content
The idea is to have a sheet that you can move from one sense application to antoher and you can use it to profile your data regardless of the data model in the back end.
I am not sure if NullCount() can do this, i would need think about it more to see if i can have the $Fields as dimension maybe in a pivot and see if the NullCount() would aggregate over all of them ?
but will need to test this out
- Mark as New
- Bookmark
- Subscribe
- Mute
- Subscribe to RSS Feed
- Permalink
- Report Inappropriate Content
Though ideally ill be able to create a KPI showing the percentage of Nulls in the data model as if it's like a density KPI
- Mark as New
- Bookmark
- Subscribe
- Mute
- Subscribe to RSS Feed
- Permalink
- Report Inappropriate Content
Hi,
I complete script code above :
profiling:
load * inline [myTable,myField,nullCount
];
for itable = 0 to NoOfTables()-1;
let vTable = TableName(itable);
for ifield= 1 to NoOfFields(vTable) ;
let vField = FieldName(ifield,tableName(itable));
profiling:
concatenate load '$(vTable)' as myTable, '$(vField)' as myField, NullCount($(vField)) as nullCount resident $(vTable);
next ifield;
next itable;
so you have your kpi in nullCount :
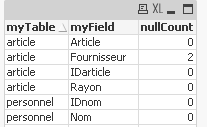
I let you complete code for other kpi (total, distinct and duplicate count 😉 )