Unlock a world of possibilities! Login now and discover the exclusive benefits awaiting you.
- Qlik Community
- :
- Forums
- :
- Analytics & AI
- :
- Products & Topics
- :
- App Development
- :
- Re: Date as Dimension
- Subscribe to RSS Feed
- Mark Topic as New
- Mark Topic as Read
- Float this Topic for Current User
- Bookmark
- Subscribe
- Mute
- Printer Friendly Page
- Mark as New
- Bookmark
- Subscribe
- Mute
- Subscribe to RSS Feed
- Permalink
- Report Inappropriate Content
Date as Dimension
Hello,
I have the following challenge.
My data source shows sales of cars and for each sale I have a date stamp.
I want to create a graph with Dimension date and KPI sales of car. On days where no car has been sold it should Show the date with Zero sale.
Right now it only shows Dates with sales.
Can someone please help me?
Thank you.
Felix
- « Previous Replies
-
- 1
- 2
- Next Replies »
Accepted Solutions
- Mark as New
- Bookmark
- Subscribe
- Mute
- Subscribe to RSS Feed
- Permalink
- Report Inappropriate Content
Hi Prashanth,
thank you for posting the script.
I changed the fields you mentioned but get an error while loading. "Field 'a' not found"
QuartersMap:
MAPPING LOAD
rowno() as Month,
'Q' & Ceil (rowno()/3) as Quarter
AUTOGENERATE (12);
Temp:
Load
min(START_DATE_WITHOUT_SET_TIMES) as minDate, //here SalesDate is from your table which referes to actual date
//(1) as maxDate //you can use this to fetch all the dates till now.
max(START_DATE_WITHOUT_SET_TIMES) as maxDate //if you want to get all dates till the last sales date
Resident Tabelle1; //You should resident from your data source in which table you have that date field
Let varMinDate = Num(Peek('minDate', 0, 'Temp'));
Let varMaxDate = Num(Peek('maxDate', 0, 'Temp'));
DROP Table Temp;
TempCalendar:
LOAD
$(varMinDate) + Iterno()-1 As Num,
Date($(varMinDate) + IterNo() - 1) as TempDate
AutoGenerate 1 While $(varMinDate) + IterNo() -1 <= $(varMaxDate);
MasterCalendar:
Load
TempDate AS [START_DATE_WITHOUT_SET_TIMES],
week(TempDate) As Week,
Year(TempDate) As Year,
Month(TempDate) As Month,
Day(TempDate) As Day,
YeartoDate(TempDate)*-1 as CurYTDFlag,
YeartoDate(TempDate,-1)*-1 as LastYTDFlag,
inyear(TempDate, Monthstart($(varMaxDate)),-1) as RC12,
date(monthstart(TempDate), 'MMM-YYYY') as MonthYear,
ApplyMap('QuartersMap', month(TempDate), Null()) as Quarter,
Week(weekstart(TempDate)) & '-' & WeekYear(TempDate) as WeekYear,
WeekDay(TempDate) as WeekDay
Resident TempCalendar Order By TempDate ASC;
Drop Table TempCalendar
- Mark as New
- Bookmark
- Subscribe
- Mute
- Subscribe to RSS Feed
- Permalink
- Report Inappropriate Content
Hi,
take a look at: Add-ons -> Data handling and check Include zero values
- Mark as New
- Bookmark
- Subscribe
- Mute
- Subscribe to RSS Feed
- Permalink
- Report Inappropriate Content
Hi Youssef,
include Zero values is activated but it still doesn't show dates where is no sales.
- Mark as New
- Bookmark
- Subscribe
- Mute
- Subscribe to RSS Feed
- Permalink
- Report Inappropriate Content
and how about checking the option "show null values" of the dimension ?
- Mark as New
- Bookmark
- Subscribe
- Mute
- Subscribe to RSS Feed
- Permalink
- Report Inappropriate Content
Same thing
- Mark as New
- Bookmark
- Subscribe
- Mute
- Subscribe to RSS Feed
- Permalink
- Report Inappropriate Content
would you be able to share Sample data or sample app ?
- Mark as New
- Bookmark
- Subscribe
- Mute
- Subscribe to RSS Feed
- Permalink
- Report Inappropriate Content
Try
The function Day(field_date) in the dimension.
Mario Centeno
- Mark as New
- Bookmark
- Subscribe
- Mute
- Subscribe to RSS Feed
- Permalink
- Report Inappropriate Content
Hi,
I uploaded an example app.
As you see the graph only shows days with sales. I want the graph to show all days and leave those days w/o sales blank.
Thanks
- Mark as New
- Bookmark
- Subscribe
- Mute
- Subscribe to RSS Feed
- Permalink
- Report Inappropriate Content
what are the dates on which you think there are no sales ?
- Mark as New
- Bookmark
- Subscribe
- Mute
- Subscribe to RSS Feed
- Permalink
- Report Inappropriate Content
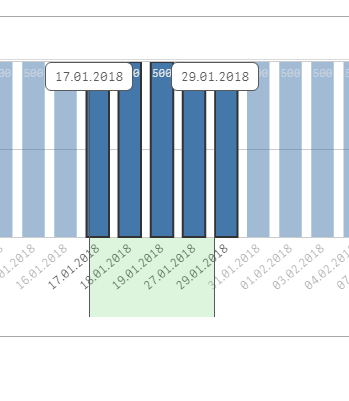
please see Screen shot below.
I would like to see all dates between 19.01.18 and 27.01.18 in the graph.
Those days wouldn't have sales and should be shown as zero.
- « Previous Replies
-
- 1
- 2
- Next Replies »