Unlock a world of possibilities! Login now and discover the exclusive benefits awaiting you.
- Qlik Community
- :
- Forums
- :
- Analytics & AI
- :
- Products & Topics
- :
- App Development
- :
- Date greater than in visualization
- Subscribe to RSS Feed
- Mark Topic as New
- Mark Topic as Read
- Float this Topic for Current User
- Bookmark
- Subscribe
- Mute
- Printer Friendly Page
- Mark as New
- Bookmark
- Subscribe
- Mute
- Subscribe to RSS Feed
- Permalink
- Report Inappropriate Content
Date greater than in visualization
Hi all,
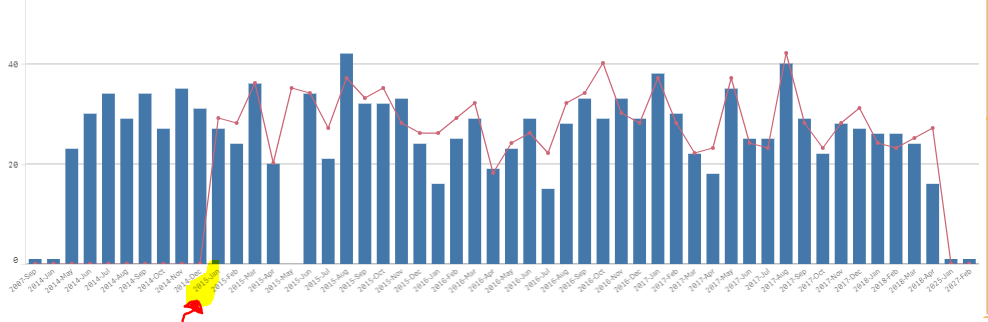
I have a combo bar/line graph that's displaying all the data for all the dates when I really only want it to show data for 3 years. I have the dimension field as
=Dual(Year([Date])&'-'&Month([Date]),MonthStart([Date]))
Which is working just fine to give the month-year. I just can't seem to get the graph to start at about Jan-2015
- Mark as New
- Bookmark
- Subscribe
- Mute
- Subscribe to RSS Feed
- Permalink
- Report Inappropriate Content
Hi,
you should use a set analysis inside your expression, what is the expression you're using ?
- Mark as New
- Bookmark
- Subscribe
- Mute
- Subscribe to RSS Feed
- Permalink
- Report Inappropriate Content
The expression posted above is what I'm using as a dimension for date
- Mark as New
- Bookmark
- Subscribe
- Mute
- Subscribe to RSS Feed
- Permalink
- Report Inappropriate Content
Hi Kyle,
The way I do it is by limiting the returned values of the dimension and expressions.
Here's one that limits the returned dates to 2018 or later.
if(Year(Promo_To_Date)>='2018',Date(Promo_To_Date,'DD.MM.YYYY')+1)
Or if you wish to use a sliding window then something like this.
if(Date(Promo_To_Date,'DD.MM.YYYY')>=Addmonths(Date(Today(2),'DD.MM.YYYY'),-1),Date(Promo_To_Date,'DD.MM.YYYY')+1)
After this I disable Null values on the field and I'm only left with the selected date range hard coded in the chart.