Unlock a world of possibilities! Login now and discover the exclusive benefits awaiting you.
- Qlik Community
- :
- Forums
- :
- Analytics & AI
- :
- Products & Topics
- :
- App Development
- :
- Re: Decile analysis. How does fractile work?
- Subscribe to RSS Feed
- Mark Topic as New
- Mark Topic as Read
- Float this Topic for Current User
- Bookmark
- Subscribe
- Mute
- Printer Friendly Page
- Mark as New
- Bookmark
- Subscribe
- Mute
- Subscribe to RSS Feed
- Permalink
- Report Inappropriate Content
Decile analysis. How does fractile work?
I have data like this:
Opportunity Value
O1 100
O2 50
O3 700
.
..
.
O1000 200
What I want to do is sort the Opportunities by Value and then create 10 sets with top 100 oppty and the total value (value) then next 100 and their total value and so on.
I tried using Fractile but not able to get it.
- Mark as New
- Bookmark
- Subscribe
- Mute
- Subscribe to RSS Feed
- Permalink
- Report Inappropriate Content
What have you tried? Can you share that
- Mark as New
- Bookmark
- Subscribe
- Mute
- Subscribe to RSS Feed
- Permalink
- Report Inappropriate Content
My sample Set of 30 values:
T4:
load * Inline [
Opp , Val
O1 , 10
O2 , 23
O3 , 45
O4 , 567
O5 , 23
O6 , 35
O7 , 567
O8 , 458
O9 , 6
O10 , 4
O11 , 67
O12 , 6
O13 , 67
O14 , 345
O15 , 22
O16 , 445
O17 , 67
O18 , 643
O19 , 9786
O20 , 56
O21 , 56
O22 , 43
O23 , 3442
O24 , 1234
O25 , 342
O26 , 455
O27 , 7698
O28 , 7909
O29 , 789
O30 , 6765];
I tried creating a Pivot table with Dimension as
=Aggr(
if(Sum(Val) <= fractile(TOTAL Aggr(Sum(Val), Opp), 0.1), 10,
if(Sum(Val) <= fractile(TOTAL Aggr(Sum(Val), Opp), 0.2), 9,
if(Sum(Val) <= fractile(TOTAL Aggr(Sum(Val), Opp), 0.3), 8,
if(Sum(Val) <= fractile(TOTAL Aggr(Sum(Val), Opp), 0.4), 7,
if(Sum(Val) <= fractile(TOTAL Aggr(Sum(Val), Opp), 0.5), 6,
if(Sum(Val) <= fractile(TOTAL Aggr(Sum(Val), Opp), 0.6), 5,
if(Sum(Val) <= fractile(TOTAL Aggr(Sum(Val), Opp), 0.7), 4,
if(Sum(Val) <= fractile(TOTAL Aggr(Sum(Val), Opp), 0.8), 3,
if(Sum(Val) <= fractile(TOTAL Aggr(Sum(Val), Opp), 0.9), 2, 1))))))))), Opp)
This gives me result like
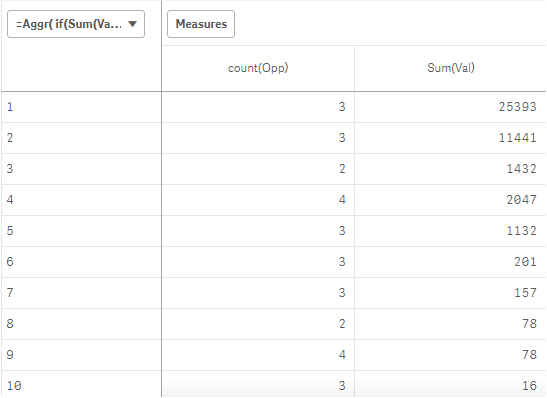
My problem it it should have done 3 Oppty in each decile but it is doing 4 in some 2 in some and 3 in some. Why?
- Mark as New
- Bookmark
- Subscribe
- Mute
- Subscribe to RSS Feed
- Permalink
- Report Inappropriate Content
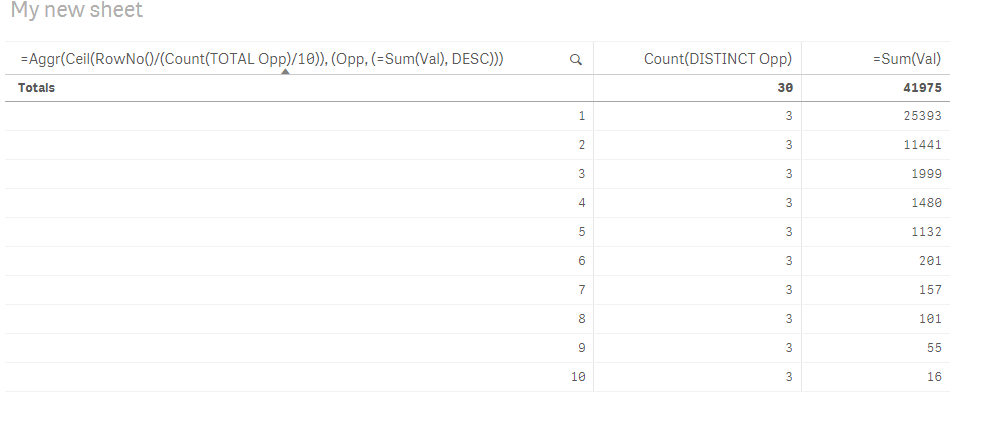
May be use this dimension
=Aggr(Ceil(RowNo()/(Count(TOTAL Opp)/10)), (Opp, (=Sum(Val), DESC)))
- Mark as New
- Bookmark
- Subscribe
- Mute
- Subscribe to RSS Feed
- Permalink
- Report Inappropriate Content
Here's how I tried.
<Loadscript>
data:
LOAD
RowNo() as Oppotunity,
RowNo()*10 as Value
AutoGenerate 500;
<Chart>
Dimension:
=Aggr(Ceil((Rank(Sum(Value))/Count(Total distinct Oppotunity))*10),Oppotunity)
