Unlock a world of possibilities! Login now and discover the exclusive benefits awaiting you.
- Qlik Community
- :
- Forums
- :
- Analytics & AI
- :
- Products & Topics
- :
- App Development
- :
- Re: Exclude non-possible DATES on chart
- Subscribe to RSS Feed
- Mark Topic as New
- Mark Topic as Read
- Float this Topic for Current User
- Bookmark
- Subscribe
- Mute
- Printer Friendly Page
- Mark as New
- Bookmark
- Subscribe
- Mute
- Subscribe to RSS Feed
- Permalink
- Report Inappropriate Content
Exclude non-possible DATES on chart
Hi,
I am facing a problem I can't solve ...
I want to represent the evolution of sales of one specific shop and compare it to the evolution of the sales of all others shops that have a similar sales revenue last month.
I made a combo chart with these specifications :
- Date as dimension
- Sum(sales) as Measure1
- Avg([set analysis] sales) as Measure2
My set analysis was made to pick among all registered shops the ones that have a similar sales revenue. It looks like this :
{ 1 <MonthlySales = {'>=$(=0.9*MonthlySales)<=$(=1.1*MonthlySales) '}>}
MonthlySales is a dimension.
It works fine for the calculation but my problem is the plotted chart : I have specific Dates where Sum(sales) = 0 for the shop I picked and I don't want these dates to appear on chart.
Unfortunately, dued to the {1 ....} of my set analysis and the fact that other shops have a Sum(sales) <> 0 on these dates, everyting is plotted on chart.
The option "include null values" for the chart is not checked, but it still plots all dates.
Any idea on how to work around this please ?
Here is a screen to clarify the situation.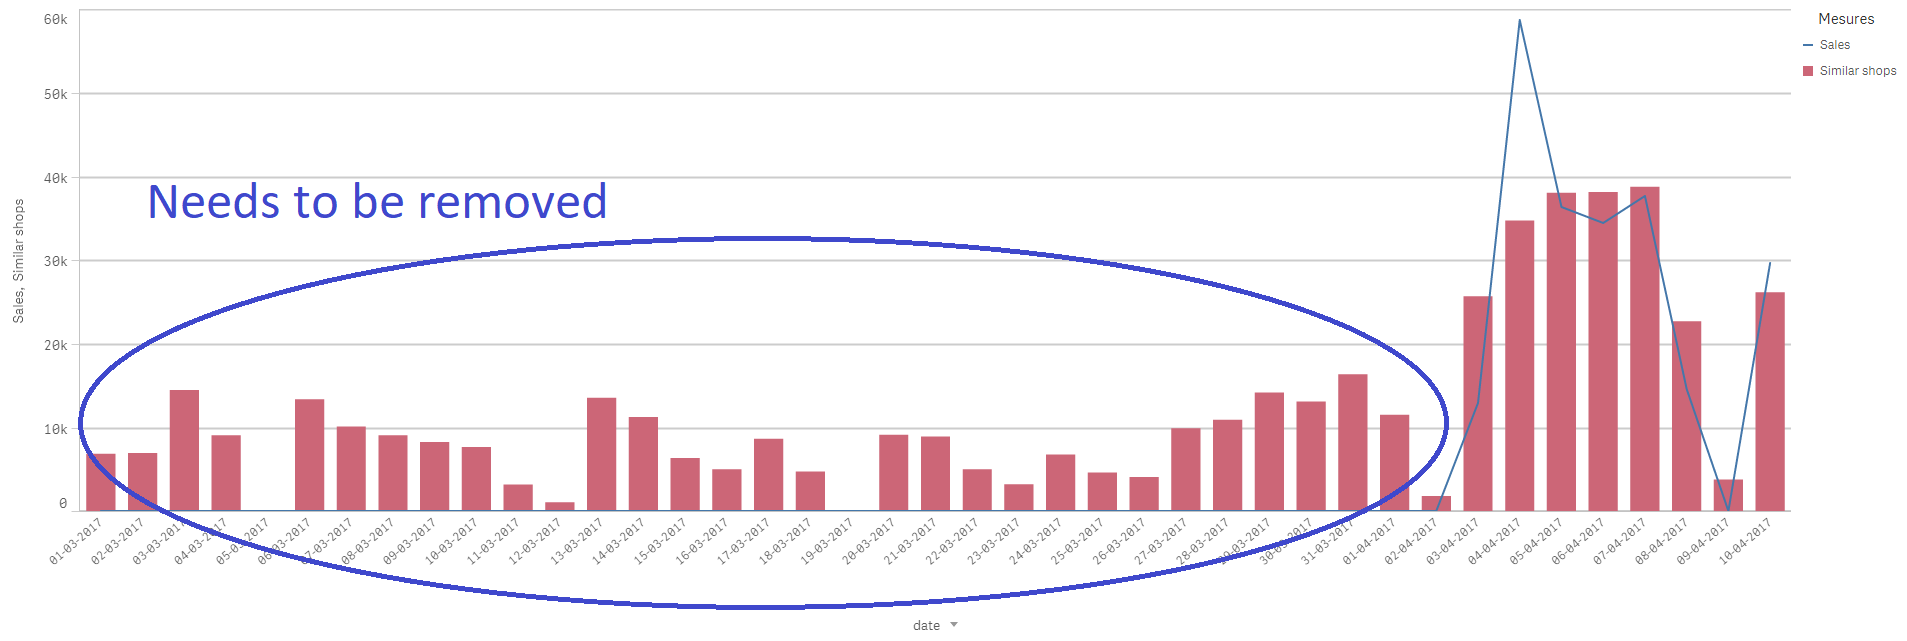
A filter pane shows the possible values for the dimension DATES :

i tried to create a new dimension based on the "possible fields", but it's a dead end for me ...
Thanks for the consideration !
- Mark as New
- Bookmark
- Subscribe
- Mute
- Subscribe to RSS Feed
- Permalink
- Report Inappropriate Content
Try to use E() in set analysis: https://help.qlik.com/en-US/sense/2.1/Subsystems/Hub/Content/ChartFunctions/SetAnalysis/set-modifier...
- Mark as New
- Bookmark
- Subscribe
- Mute
- Subscribe to RSS Feed
- Permalink
- Report Inappropriate Content
Hi Tomasz,
Thanks for the guidance ! Unfortunately, I've never used the P() & E() functions, could you give me a hand on the structure that could help me ? I'm guessing in pseudo code, it would be something like :
Date = E( {<sum(sales) = {0}>} id_of_specific_shop)
- Mark as New
- Bookmark
- Subscribe
- Mute
- Subscribe to RSS Feed
- Permalink
- Report Inappropriate Content
May be
{ 1 <MonthlySales = {'>=$(=0.9*MonthlySales)<=$(=1.1*MonthlySales) '},date=$::date>}
- Mark as New
- Bookmark
- Subscribe
- Mute
- Subscribe to RSS Feed
- Permalink
- Report Inappropriate Content
Other way:
1. for the measure2 use:
if ( [measure1 formula]=0,0,[measure2 formula] )
2. In 'data handling' panel uncheck 'Show zero values'
- Mark as New
- Bookmark
- Subscribe
- Mute
- Subscribe to RSS Feed
- Permalink
- Report Inappropriate Content
None of these techniques work for me 😕
I can't get the proper E() expression in my set analysis
For the IF idea, It plots the line even with the zero values on some dates (very strange ...)
- Mark as New
- Bookmark
- Subscribe
- Mute
- Subscribe to RSS Feed
- Permalink
- Report Inappropriate Content
Thanks for the idea but it didn't work either 