Unlock a world of possibilities! Login now and discover the exclusive benefits awaiting you.
- Qlik Community
- :
- Forums
- :
- Analytics & AI
- :
- Products & Topics
- :
- App Development
- :
- Re: Filter on a measure
- Subscribe to RSS Feed
- Mark Topic as New
- Mark Topic as Read
- Float this Topic for Current User
- Bookmark
- Subscribe
- Mute
- Printer Friendly Page
- Mark as New
- Bookmark
- Subscribe
- Mute
- Subscribe to RSS Feed
- Permalink
- Report Inappropriate Content
Filter on a measure
Hi everybody.
An user ask us to make himself a measure based on a filter. It is possible?
If we have one dimension (Country) and one measure (Sales), could him make a chart with "total sales" vs "Germany Sales" without making an specific measure for Germany?
Thanks in advance.
Accepted Solutions
- Mark as New
- Bookmark
- Subscribe
- Mute
- Subscribe to RSS Feed
- Permalink
- Report Inappropriate Content
Hi
If you are using Qliksense do the following
add the below to the script
load * inline [

dim

1

2

];
Reload
Add below as your dimension
First dimension [Month Year]
Second dimension pick(dim, Country,'Total')
Expression
Sum(Sales)
- Mark as New
- Bookmark
- Subscribe
- Mute
- Subscribe to RSS Feed
- Permalink
- Report Inappropriate Content
Sum({<Country={'Germany'>}Sales) will give you sales for germany. Is this what you wanted.
Please check the field names and value or it may throw an error.
- Mark as New
- Bookmark
- Subscribe
- Mute
- Subscribe to RSS Feed
- Permalink
- Report Inappropriate Content
Sure, you can use set analysis for this
Total Sales
Sum(Sales)
Germany Sales
Sum({<Country = {'Germany'}>}Sales)
- Mark as New
- Bookmark
- Subscribe
- Mute
- Subscribe to RSS Feed
- Permalink
- Report Inappropriate Content
I'm sorry but I can't use set analysis.
We have a master measure named SALES and we want to know how can the user use this unique measures in both cases, Total sales and Germany Sales in the same chart
Thanks
- Mark as New
- Bookmark
- Subscribe
- Mute
- Subscribe to RSS Feed
- Permalink
- Report Inappropriate Content
Why not create another master measure for user called GermanySales, they can drag Germany sales to see the total. I can't think of any other than changing the script that could do this. It would be easier if you create it in the UI.
- Mark as New
- Bookmark
- Subscribe
- Mute
- Subscribe to RSS Feed
- Permalink
- Report Inappropriate Content
Thanks
- Mark as New
- Bookmark
- Subscribe
- Mute
- Subscribe to RSS Feed
- Permalink
- Report Inappropriate Content
I think I fail to understand what you are trying to do. Why can't you use set analysis here? Can you share a flow of events that will happen and what you would want to see at the end?
- Mark as New
- Bookmark
- Subscribe
- Mute
- Subscribe to RSS Feed
- Permalink
- Report Inappropriate Content
We have a data set like this. Sales by country and month.
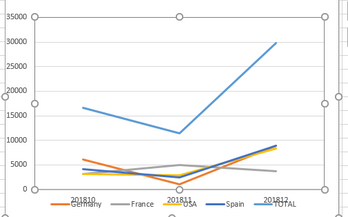
And we want to do something like this, but with only one expression. We don't want an expression for each country because we have sales, quantity, ebit... and maybe 25 countries. It will make about 150 expressions.
Is there a way to the user drag the Sales expression and filter it by a country? Then we had Sales of a country vs Total sales
- Mark as New
- Bookmark
- Subscribe
- Mute
- Subscribe to RSS Feed
- Permalink
- Report Inappropriate Content
Create a line chart with monthyear as first dimension and country as second dimension. and use Sum(Sales) as expression. Now go to Dimension limits tab and check box for the total.
- Mark as New
- Bookmark
- Subscribe
- Mute
- Subscribe to RSS Feed
- Permalink
- Report Inappropriate Content
Hi
If you are using Qliksense do the following
add the below to the script
load * inline [

dim

1

2

];
Reload
Add below as your dimension
First dimension [Month Year]
Second dimension pick(dim, Country,'Total')
Expression
Sum(Sales)

