Unlock a world of possibilities! Login now and discover the exclusive benefits awaiting you.

- Qlik Community
- :
- Forums
- :
- Analytics & AI
- :
- Products & Topics
- :
- App Development
- :
- Re: Format Date Dimension 'MMM YYYY' (QS April 18)
- Subscribe to RSS Feed
- Mark Topic as New
- Mark Topic as Read
- Float this Topic for Current User
- Bookmark
- Subscribe
- Mute
- Printer Friendly Page

 wdchristensen
- Mark as New
- Bookmark
- Subscribe
- Mute
- Subscribe to RSS Feed
- Permalink
- Report Inappropriate Content
Format Date Dimension 'MMM YYYY' (QS April 18)
I am trying to get my line chart to show the date as something like 'Jan 2018'. If I create a pivot table, I can get this representation by simply putting the formatting in the formula like: Date(MonthStart(DateOfEvent), 'MMM YYYY')
For some reason when I put this in the line chart it renders as m/d/yyyy. I suspect there a feature that is overriding my formatting but I am not sure where that setting can be changed. Ideally I would like to change the formatting at the object level and not the application level. Any help would be greatly appreciated! Thanks
- Tags:
- date format
 wdchristensen
- Mark as New
- Bookmark
- Subscribe
- Mute
- Subscribe to RSS Feed
- Permalink
- Report Inappropriate Content
I tried using:
Month("DateOfEvent")&'-'& Year("DateOfEvent") AS MonthYear
but that kills my sorting so I was considering loading:
Dual(Date(MonthStart(DateOfEvent), 'MMM YYYY'), Month("DateOfEvent")&'-'& Year("DateOfEvent") AS MonthYearDual
The hope is that I can use the text for the visualization and the number for the sort. I am resorting to the classic trial end error method. I thought that I should be able to use MonthYear in the visualization and just override the sort with a custom expression but for some reason when I apply a filter it scrambles the sort order. This seems like it should be a quick fix but it is turning out to be rather time consuming...

 merola_faria
- Mark as New
- Bookmark
- Subscribe
- Mute
- Subscribe to RSS Feed
- Permalink
- Report Inappropriate Content
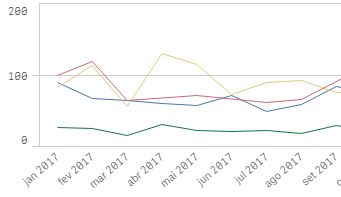
Try using just :
MonthName("DateOfEvent") as MonthYear
It give you a date field in format jan 2018, fev 2018, etc, that you can use for visualization and sorting.