Unlock a world of possibilities! Login now and discover the exclusive benefits awaiting you.
Announcements
Qlik and ServiceNow Partner to Bring Trusted Enterprise Context into AI-Powered Workflows. Learn More!
- Qlik Community
- :
- Forums
- :
- Analytics & AI
- :
- Products & Topics
- :
- App Development
- :
- Grouped Bar Chart, 2 Measures with different colou...
Options
- Subscribe to RSS Feed
- Mark Topic as New
- Mark Topic as Read
- Float this Topic for Current User
- Bookmark
- Subscribe
- Mute
- Printer Friendly Page
Turn on suggestions
Auto-suggest helps you quickly narrow down your search results by suggesting possible matches as you type.
Showing results for
Partner - Contributor II
2018-09-25
11:32 AM
- Mark as New
- Bookmark
- Subscribe
- Mute
- Subscribe to RSS Feed
- Permalink
- Report Inappropriate Content
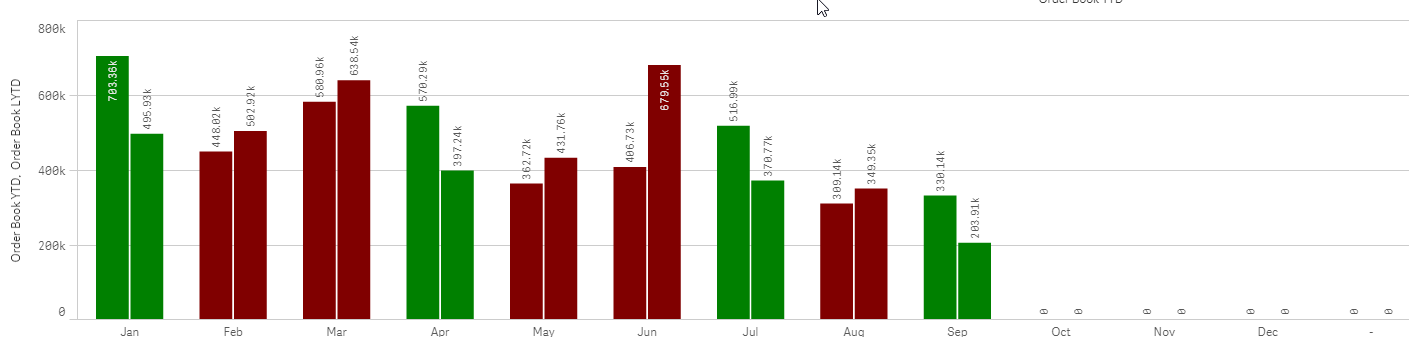
Grouped Bar Chart, 2 Measures with different colours
Hi All,
I'm looking to colours the bars on the chart below, however when I apply my formulat
that looks like if(sum(YTD)>sum(LYTD), Green(), Red()), however it apllys the same colur to both bars when I apply it.
I'd be happy to get Green or Red for the YTD and LYTD as gray or blue.
Cheers
Steve
434 Views
0 Replies