Unlock a world of possibilities! Login now and discover the exclusive benefits awaiting you.
- Qlik Community
- :
- Forums
- :
- Analytics & AI
- :
- Products & Topics
- :
- App Development
- :
- Grouped Bar Chart Conditional Coloring
- Subscribe to RSS Feed
- Mark Topic as New
- Mark Topic as Read
- Float this Topic for Current User
- Bookmark
- Subscribe
- Mute
- Printer Friendly Page
- Mark as New
- Bookmark
- Subscribe
- Mute
- Subscribe to RSS Feed
- Permalink
- Report Inappropriate Content
Grouped Bar Chart Conditional Coloring
Hi,
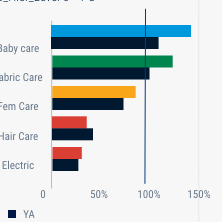
I'm trying to create a grouped bar chart per Business Unit.
The chart contains 2 measures:
1. actual sales vs budget this year
2. actual sales vs budget year ago
the is to color the measures by different rule. for example consider the following:
The first measure will be colored according to defined coloring (<80% in Red, 80%-100% in Yellow, 100%-120% in Green, over 120% in Light Blue).
The second measure will be colored constantly in Dark Blue.
see attached illustration.
if not possible - does someone has an idea of similar way to present the same which is possible?
Thanks a lot!
- Mark as New
- Bookmark
- Subscribe
- Mute
- Subscribe to RSS Feed
- Permalink
- Report Inappropriate Content
if you don't mind then could you attach here you sample qvf file with dummy data
- Mark as New
- Bookmark
- Subscribe
- Mute
- Subscribe to RSS Feed
- Permalink
- Report Inappropriate Content
Hi,
I can't provide a sample app, I can create a sample data even though I don't see the point.
Is it possible to color grouped bar chart but separate the coloring by measures?
I tried also to provide coloring to the measures as a maser items but unlike coloring a table value, in bar chart it seems impossible. also coloring master measure where the measure indicates a percentage and the value in necessarily between 0% and 100%