Unlock a world of possibilities! Login now and discover the exclusive benefits awaiting you.
- Qlik Community
- :
- Forums
- :
- Analytics & AI
- :
- Products & Topics
- :
- App Development
- :
- Help on Chart Type or Synthetic Dimension
- Subscribe to RSS Feed
- Mark Topic as New
- Mark Topic as Read
- Float this Topic for Current User
- Bookmark
- Subscribe
- Mute
- Printer Friendly Page
- Mark as New
- Bookmark
- Subscribe
- Mute
- Subscribe to RSS Feed
- Permalink
- Report Inappropriate Content
Help on Chart Type or Synthetic Dimension
Hi All,
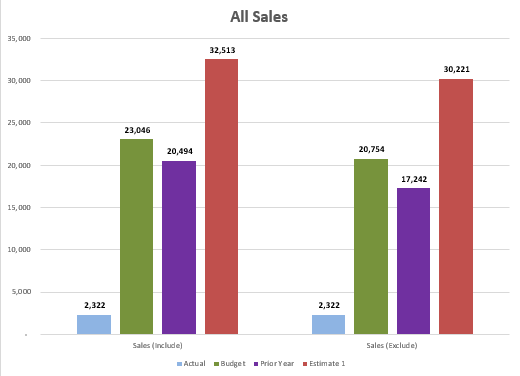
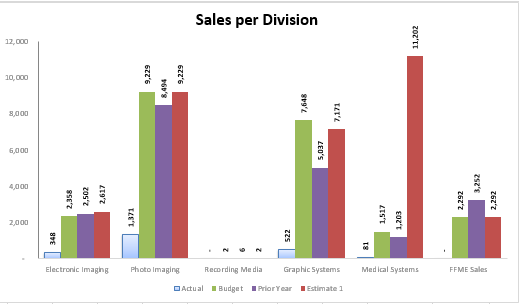
I want to create a chart like the ones below, what is the best way to achieve it?
Thanks for your help in anticipation.
- Mark as New
- Bookmark
- Subscribe
- Mute
- Subscribe to RSS Feed
- Permalink
- Report Inappropriate Content
Can you provide more info on what you want to achieve?
What is the "Sales (exclude)" / "Sales (include)" dimension.
I'm assuming you want to aggregate the multiple bars into one same bar, but only with pictures its a little hard to help.
- Mark as New
- Bookmark
- Subscribe
- Mute
- Subscribe to RSS Feed
- Permalink
- Report Inappropriate Content
Hi Felip,
The first chart is measures only (I've been able to achieve this with valuelist but only for the 'exclude' part), no dimensions, the exclude is a particular division- FFME which is separated in the second chart. How do create a bar chart with two levels of synthetic dimensions?
The second chart is the same as the top one except it has an additional dimension grouping, i.e. by division.
Thanks for your response.
- Mark as New
- Bookmark
- Subscribe
- Mute
- Subscribe to RSS Feed
- Permalink
- Report Inappropriate Content
Not sure i understand your logic completely but i think you may need value list (include, exclude0 as one of the dimensions
check below for example