Unlock a world of possibilities! Login now and discover the exclusive benefits awaiting you.
- Qlik Community
- :
- Forums
- :
- Analytics & AI
- :
- Products & Topics
- :
- App Development
- :
- Re: How can I list values including text format wi...
- Subscribe to RSS Feed
- Mark Topic as New
- Mark Topic as Read
- Float this Topic for Current User
- Bookmark
- Subscribe
- Mute
- Printer Friendly Page
- Mark as New
- Bookmark
- Subscribe
- Mute
- Subscribe to RSS Feed
- Permalink
- Report Inappropriate Content
How can I list values including text format with a condition on a chart?
Hello,
I work as a analyst manager in a company. I came across a bottle neck with qlik sense.
We have traffic systems installed in different countries and i have to deliver monthly reports about percentage of violations, enforcements etc.
The systems are so called TVR s have their unique ID's. My database is excel sheets with a clear format.
My main goal is to create a chart(line,bar etc.) with tower IDs as a dimension and lets say checked violations as a measure. But i want to set one or two conditions for TVR ID dimension.I couldnt find anywhere how to do it.You can find related app file attached. At the last page which called Monthly results i have a a chart and a invalid dimension. I'm new to script language and what i wrote was :
if(count({<[Violation Profile]={'Green signal issue'}>}[Violation Profile])>1000,[TVR Code-Viol_March.TVR Code],)
Can you help mi with that?
Best regards
- « Previous Replies
- Next Replies »
Accepted Solutions
- Mark as New
- Bookmark
- Subscribe
- Mute
- Subscribe to RSS Feed
- Permalink
- Report Inappropriate Content
I have attached two ways it can be done in this qlikview sample
1)
Sum(Aggr(If(FirstSortedValue(Makes, -Aggr(Count(Makes), Lanes, Makes)) = Makes, 1, 0), Lanes, Makes, RowNo))
Where RowNo was the UniqueIdentifier created in the script
Table:
LOAD *,
RowNo() as RowNo;
LOAD * INLINE [
Lanes, Makes
1, Opel
2, Honda
3, Ford
2, BMW
3, Mercedes
1, Ford
2, Opel
3, Mercedes
2, BMW
3, Mercedes
1, Ford
2, BMW
3, Honda
];
2)
Count(Aggr(If(FirstSortedValue(Makes, -Aggr(Count(Makes), Lanes, Makes)) = Makes, Makes, 0), Lanes, Makes))
This can be translated to yours like this (putting it down in a minute)
Count(Aggr(If(FirstSortedValue([Violation Profile], -Aggr(Count({<[Violation Profile]=-{'Checked'}>}[Violation Profile]), [TVR Code-Viol_March.TVR Code], [Violation Profile], MonthFieldHere)) = [Violation Profile], [Violation Profile]), [TVR Code-Viol_March.TVR Code], [Violation Profile], MonthFieldHere))
- Mark as New
- Bookmark
- Subscribe
- Mute
- Subscribe to RSS Feed
- Permalink
- Report Inappropriate Content
What is the output you are looking to get? The problem is that you cannot use Aggregate functions such as Count, Sum, Min, Max in the script without Aggr() function (or TOTAL qualifier). But I don't know what you are looking to get to suggest anything. Can you explain what you want and may be share the output you are looking to get?
- Mark as New
- Bookmark
- Subscribe
- Mute
- Subscribe to RSS Feed
- Permalink
- Report Inappropriate Content
Hi Sunny ,
I could not understand what was your point with aggr() obligation. I have so many apps that are running correctly on script without aggr(). I only used it with firstorderget function.
So i have a database file like this. Checked means correct violations, the others are system issues. what i m trying to do is making a line or bar chart and adding TVR codes as a dimension. But i want to set conditions when defining this dimension.
For example, is it possible to show only tower codes with more than 5 checked violation profile count and with more than %50 checked/total violation profile ratio?
| TVR Code | Date | Time | Day Cycle | Violation Profile |
| IP55CTVR2 | 01.03.2017 | 00:03 | Night | Image problem |
| IP47ATVR1 | 01.03.2017 | 00:06 | Night | Checked |
| IP72TVR2 | 01.03.2017 | 00:32 | Night | Checked |
| IP47ATVR1 | 01.03.2017 | 00:39 | Night | Image problem |
| IP55CTVR2 | 01.03.2017 | 00:55 | Night | Checked |
| IP47ATVR1 | 01.03.2017 | 01:11 | Night | Image problem |
| IP2TVR1 | 01.03.2017 | 01:20 | Night | Image problem |
| IP20TVR1 | 01.03.2017 | 01:38 | Night | Checked |
| IP20TVR1 | 01.03.2017 | 01:47 | Night | Image problem |
| IP2TVR1 | 01.03.2017 | 01:56 | Night | Checked |
| IP76TVR3 | 01.03.2017 | 02:23 | Night | Image problem |
| IP2TVR1 | 01.03.2017 | 02:39 | Night | Image problem |
| IP26TVR1 | 01.03.2017 | 02:59 | Night | Emergency situation |
| IP55CTVR2 | 01.03.2017 | 03:19 | Night | Image problem |
| IP1ETVR2 | 01.03.2017 | 04:03 | Night | Image problem |
| IP28ATVR1 | 01.03.2017 | 04:32 | Night | Image problem |
| IP55CTVR2 | 01.03.2017 | 04:34 | Night | Checked |
| IP55CTVR2 | 01.03.2017 | 05:03 | Night | Checked |
| IP20TVR1 | 01.03.2017 | 05:08 | Night | Checked |
| IP55CTVR2 | 01.03.2017 | 05:14 | Night | Checked |
| IP40TVR4 | 01.03.2017 | 05:43 | Day | Image problem |
| IP76TVR2 | 01.03.2017 | 05:48 | Day | Checked |
| IP55CTVR2 | 01.03.2017 | 05:50 | Day | Checked |
| IP20TVR1 | 01.03.2017 | 06:11 | Day | Checked |
| IP55CTVR2 | 01.03.2017 | 06:16 | Day | Checked |
| IP2TVR3 | 01.03.2017 | 06:31 | Day | Yellow light |
| IP55CTVR2 | 01.03.2017 | 06:37 | Day | Checked |
| IP55CTVR2 | 01.03.2017 | 06:39 | Day | Checked |
| IP40TVR4 | 01.03.2017 | 06:47 | Day | Checked |
- Mark as New
- Bookmark
- Subscribe
- Mute
- Subscribe to RSS Feed
- Permalink
- Report Inappropriate Content
Hi Sunny,
I could not understand what was your point when saying i have to use aggr() function in a script. I have so many apps at the attachment that are working fine without it. Just for firstordervalue(), i use aggr() function
To give an example: This table represents my database. Checked means correct and the others are system problems.
I want to make a bar or line chart and add TVR Codes s as dimension. But i dont want my chart to show all codes. I want to set one or two conditions.
For example; i just want to see TVR Codes with more than 10 checked violation profile count.
| TVR Code | Date | Time | Day Cycle | Violation Profile |
| IP55CTVR2 | 01.03.2017 | 00:03 | Night | Image problem |
| IP47ATVR1 | 01.03.2017 | 00:06 | Night | Checked |
| IP72TVR2 | 01.03.2017 | 00:32 | Night | Checked |
| IP47ATVR1 | 01.03.2017 | 00:39 | Night | Image problem |
| IP55CTVR2 | 01.03.2017 | 00:55 | Night | Checked |
| IP47ATVR1 | 01.03.2017 | 01:11 | Night | Image problem |
| IP2TVR1 | 01.03.2017 | 01:20 | Night | Image problem |
| IP20TVR1 | 01.03.2017 | 01:38 | Night | Checked |
| IP20TVR1 | 01.03.2017 | 01:47 | Night | Image problem |
| IP2TVR1 | 01.03.2017 | 01:56 | Night | Checked |
| IP76TVR3 | 01.03.2017 | 02:23 | Night | Image problem |
| IP2TVR1 | 01.03.2017 | 02:39 | Night | Image problem |
| IP26TVR1 | 01.03.2017 | 02:59 | Night | Emergency situation |
| IP55CTVR2 | 01.03.2017 | 03:19 | Night | Image problem |
| IP1ETVR2 | 01.03.2017 | 04:03 | Night | Image problem |
| IP28ATVR1 | 01.03.2017 | 04:32 | Night | Image problem |
| IP55CTVR2 | 01.03.2017 | 04:34 | Night | Checked |
| IP55CTVR2 | 01.03.2017 | 05:03 | Night | Checked |
| IP20TVR1 | 01.03.2017 | 05:08 | Night | Checked |
| IP55CTVR2 | 01.03.2017 | 05:14 | Night | Checked |
| IP40TVR4 | 01.03.2017 | 05:43 | Day | Image problem |
| IP76TVR2 | 01.03.2017 | 05:48 | Day | Checked |
| IP55CTVR2 | 01.03.2017 | 05:50 | Day | Checked |
| IP20TVR1 | 01.03.2017 | 06:11 | Day | Checked |
| IP55CTVR2 | 01.03.2017 | 06:16 | Day | Checked |
| IP2TVR3 | 01.03.2017 | 06:31 | Day | Yellow light |
| IP55CTVR2 | 01.03.2017 | 06:37 | Day | Checked |
| IP55CTVR2 | 01.03.2017 | 06:39 | Day | Checked |
| IP40TVR4 | 01.03.2017 | 06:47 | Day | Checked |
- Mark as New
- Bookmark
- Subscribe
- Mute
- Subscribe to RSS Feed
- Permalink
- Report Inappropriate Content
Are you looking to get this?
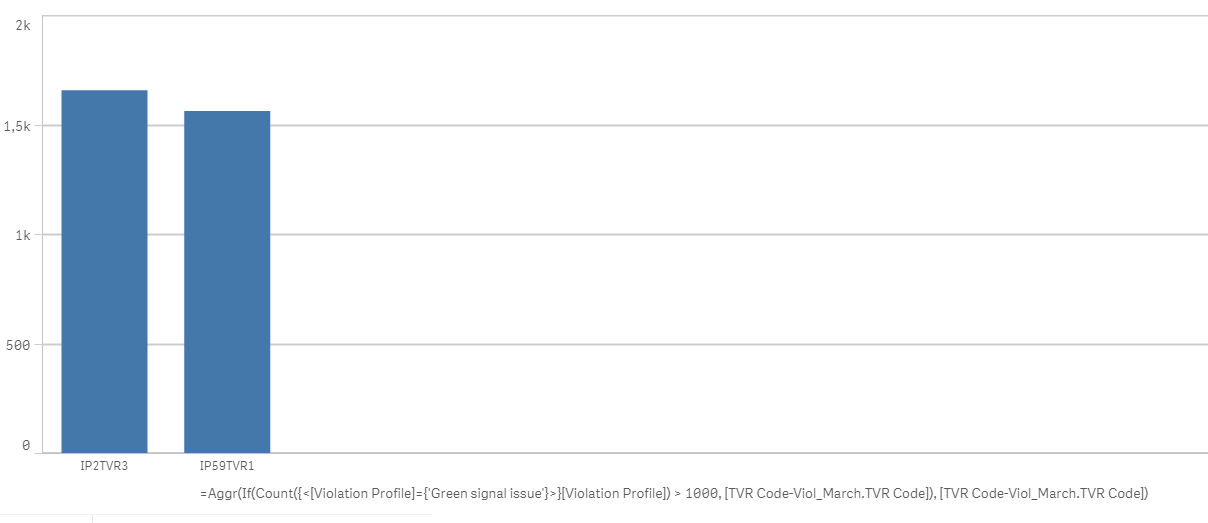
Dimension
=Aggr(If(Count({<[Violation Profile]={'Green signal issue'}>}[Violation Profile]) > 1000, [TVR Code-Viol_March.TVR Code]), [TVR Code-Viol_March.TVR Code])
Expression
Count([Violation Profile])
- Mark as New
- Bookmark
- Subscribe
- Mute
- Subscribe to RSS Feed
- Permalink
- Report Inappropriate Content
Thank you Sunny,
It works right know. Can i add additional condition to that expression?
- Mark as New
- Bookmark
- Subscribe
- Mute
- Subscribe to RSS Feed
- Permalink
- Report Inappropriate Content
Sure, what conditions do you wish to add in there?
- Mark as New
- Bookmark
- Subscribe
- Mute
- Subscribe to RSS Feed
- Permalink
- Report Inappropriate Content
Actually, your reply is enough for me. I can edit your formula like :
=Aggr(If(Count({<[Violation Profile]={'Green signal issue'} AND another condition >}[Violation Profile]) > 1000, [TVR Code-Viol_March.TVR Code]), [TVR Code-Viol_March.TVR Code])
It can be percentage or green signal issues to total for example.
Thank you so much
- Mark as New
- Bookmark
- Subscribe
- Mute
- Subscribe to RSS Feed
- Permalink
- Report Inappropriate Content
That's great... I am glad you are willing to do this on your own.
Best,
Sunny
- Mark as New
- Bookmark
- Subscribe
- Mute
- Subscribe to RSS Feed
- Permalink
- Report Inappropriate Content
I had no script language knowledge until i started to use QLİK sense. But with googling, community and youtube and some trying, i could manage to come up with results.
But when trying to extract data that depends on many variables, i can get stuck. I think about getting continous education from QLİK.
Will it be efficient for me?
- « Previous Replies
- Next Replies »