Unlock a world of possibilities! Login now and discover the exclusive benefits awaiting you.
- Qlik Community
- :
- Forums
- :
- Analytics & AI
- :
- Products & Topics
- :
- App Development
- :
- Re: How to achieve accumulative sum in charts
- Subscribe to RSS Feed
- Mark Topic as New
- Mark Topic as Read
- Float this Topic for Current User
- Bookmark
- Subscribe
- Mute
- Printer Friendly Page
- Mark as New
- Bookmark
- Subscribe
- Mute
- Subscribe to RSS Feed
- Permalink
- Report Inappropriate Content
How to achieve accumulative sum in charts
Hi all, I have come across a problem, which sounds simple but i just could not get it done.
Basically, i used RANGESUM(ABOVE(SUM([measure]),0,ROWNO()) in a chart to demonstrate accumulative sum by month. as shown below.
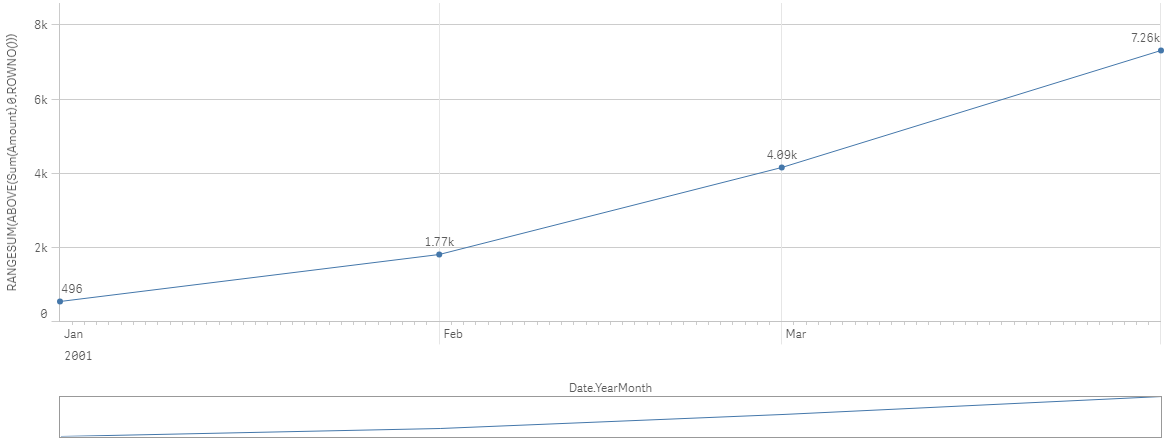
when i pick a month or a few month, the accumulative number will get reset, which is normal.
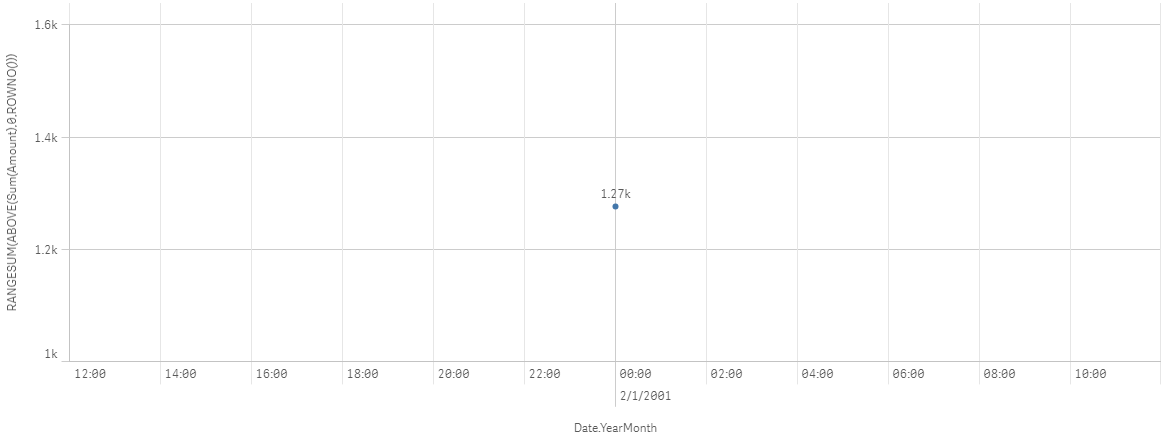
however, what i really like to see is the numbers stay as they are no matter which month(s) i pick. for example, if I pick feb, it should display 1.77k instead of 1.27k.
i also want flexibility so i prefer in-chart function rather than summary data set calculated in load process.
in theory, i could use some sort of set analysis that sum all the value where month<= the month picked, or min(months picked), but i just could not come up with a satisfactory solution.
has anyone solved similar problems like this before? thanks in advance.
p.s.
data table as follow
Load
*,
MONTHNAME(Date) AS MonthYear
;
Load
DATE('01/01/2001' + RECNO() - 1) AS Date,
RECNO() AS Amount
autogenerate(NUM(DATE#('30/04/2001'))-NUM(DATE#('01/01/2001'))+1);
Accepted Solutions
- Mark as New
- Bookmark
- Subscribe
- Mute
- Subscribe to RSS Feed
- Permalink
- Report Inappropriate Content
AccumulatedDataTmp:
LOAD
MonthYear,
Sum(Amount) AS [Amount Accumulated by Month]
RESIDENT Data
GROUP BY MonthYear
;
INNER JOIN(AccumulatedDataTmp)
LOAD
MonthYear AS MonthYear1,
"Amount Accumulated by Month" AS [Amount Accumulated by Month 1]
RESIDENT AccumulatedDataTmp;
[AccumulatedData]:
LOAD
MonthYear,
Sum([Amount Accumulated by Month 1]) AS [Amount Accumulated by Month]
RESIDENT AccumulatedDataTmp
WHERE MonthYear >= MonthYear1
GROUP BY MonthYear
;
DROP TABLE AccumulatedDataTmp;
- Mark as New
- Bookmark
- Subscribe
- Mute
- Subscribe to RSS Feed
- Permalink
- Report Inappropriate Content
Try this
RangeSum(Above(Sum({<Date.YearMonth>}[measure]), 0, RowNo()) * Avg(1)
- Mark as New
- Bookmark
- Subscribe
- Mute
- Subscribe to RSS Feed
- Permalink
- Report Inappropriate Content
thanks Sunny, but it did not work, maybe you misunderstood what I wrote above. I will re-write the description
- Mark as New
- Bookmark
- Subscribe
- Mute
- Subscribe to RSS Feed
- Permalink
- Report Inappropriate Content
I don't know what your MonthYear field is called, but this is the basic concept is that you need to ignore selection in this field and then multiply your expression by Avg(1)
RangeSum(Above(Sum({<MonthYear>}[measure]), 0, RowNo()) * Avg(1)
- Mark as New
- Bookmark
- Subscribe
- Mute
- Subscribe to RSS Feed
- Permalink
- Report Inappropriate Content
Sunny -
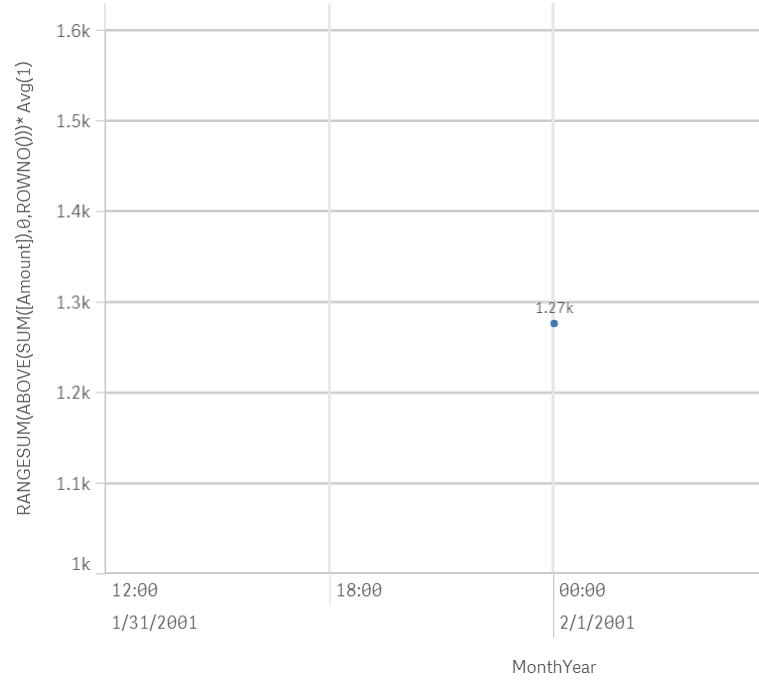
I tried this as I was curious (haven't used RangeSum). So loaded data as Jinghua stated and got same result with your expression. What is multiplying by Avg(1) supposed to do?
I did have to fix the initial expression - it was short a parenthesis at the end
RangeSum(ABOVE(SUM([Amount]),0,ROWNO() ) )
see attached with 1st being all months and 2nd being Feb selected - mine changed to 1.27 also. Plus I also notice that it changes the scale on the X axis - adds what looks like duration format (12:00 18:00 ...)
- Mark as New
- Bookmark
- Subscribe
- Mute
- Subscribe to RSS Feed
- Permalink
- Report Inappropriate Content
Multiplying with Avg(1) is not the only thing, the other important part is to ignore selection in the your dimension field. Avg(1) is just used to make out of selection dates or months = 0 and ignoring will make sure that the accumulation is not impacted by the selection of date or month.
- Mark as New
- Bookmark
- Subscribe
- Mute
- Subscribe to RSS Feed
- Permalink
- Report Inappropriate Content
i have tried numerous formulas and combinations, still no luck. for the moment, i am generating a accumulated summary table in load process to achieve static accumulated number
- Mark as New
- Bookmark
- Subscribe
- Mute
- Subscribe to RSS Feed
- Permalink
- Report Inappropriate Content
Share a sample?
- Mark as New
- Bookmark
- Subscribe
- Mute
- Subscribe to RSS Feed
- Permalink
- Report Inappropriate Content
AccumulatedDataTmp:
LOAD
MonthYear,
Sum(Amount) AS [Amount Accumulated by Month]
RESIDENT Data
GROUP BY MonthYear
;
INNER JOIN(AccumulatedDataTmp)
LOAD
MonthYear AS MonthYear1,
"Amount Accumulated by Month" AS [Amount Accumulated by Month 1]
RESIDENT AccumulatedDataTmp;
[AccumulatedData]:
LOAD
MonthYear,
Sum([Amount Accumulated by Month 1]) AS [Amount Accumulated by Month]
RESIDENT AccumulatedDataTmp
WHERE MonthYear >= MonthYear1
GROUP BY MonthYear
;
DROP TABLE AccumulatedDataTmp;