Unlock a world of possibilities! Login now and discover the exclusive benefits awaiting you.
- Qlik Community
- :
- Forums
- :
- Analytics & AI
- :
- Products & Topics
- :
- App Development
- :
- Re: How to apply RangeSum in a Synthetic Dimension...
- Subscribe to RSS Feed
- Mark Topic as New
- Mark Topic as Read
- Float this Topic for Current User
- Bookmark
- Subscribe
- Mute
- Printer Friendly Page
- Mark as New
- Bookmark
- Subscribe
- Mute
- Subscribe to RSS Feed
- Permalink
- Report Inappropriate Content
How to apply RangeSum in a Synthetic Dimension?
What am I doing wrong?
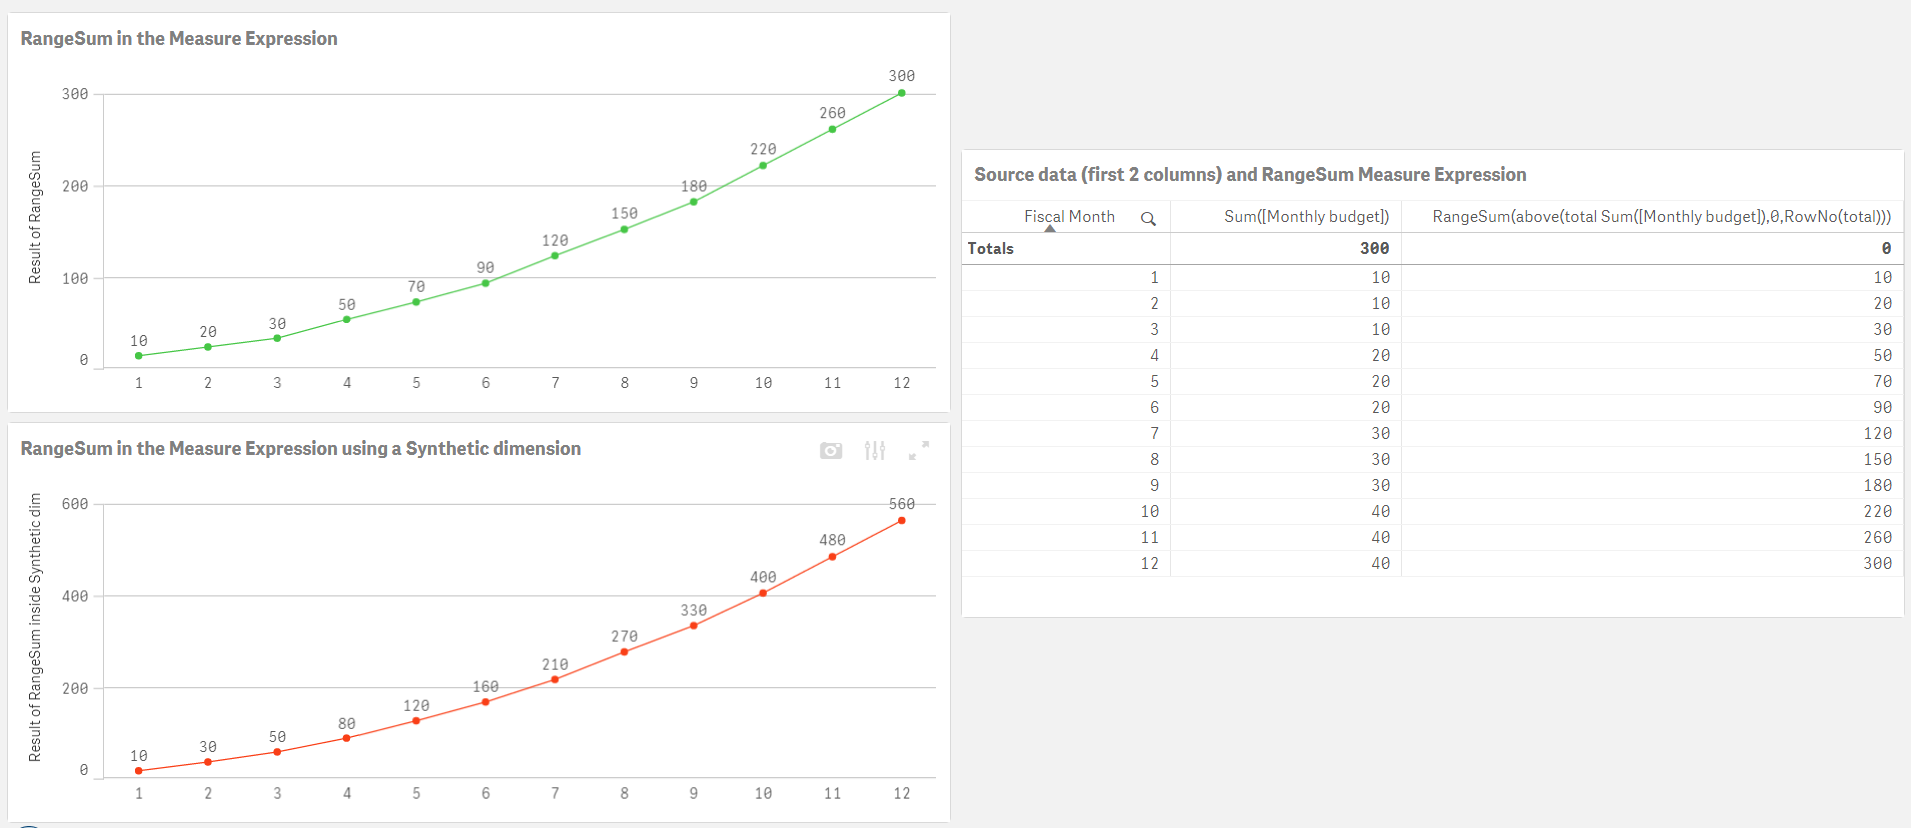
I am using RangeSum in a Synthetic Dimension but the result isn't the same as using RangeSum in a normal Measure Expression.
The Expression I am using in the Synthetic Dimension is:
If(ValueList('Measure Expression','Dummy')='Measure Expression', RangeSum(above(total Sum([Monthly budget]),0,RowNo(total))))
I would like to have the result as with the RangeSum in the normal Measure Expression:
RangeSum(above(total Sum([Monthly budget]),0,RowNo(total)))
- « Previous Replies
-
- 1
- 2
- Next Replies »
- Mark as New
- Bookmark
- Subscribe
- Mute
- Subscribe to RSS Feed
- Permalink
- Report Inappropriate Content
Do you have two dimensions in your chart? ValueList and FiscalMonth?
- Mark as New
- Bookmark
- Subscribe
- Mute
- Subscribe to RSS Feed
- Permalink
- Report Inappropriate Content
Yes, I have two dimensions in my chart; the first dimension is the Fiscal Month and the second dimension is the ValueList.
- Mark as New
- Bookmark
- Subscribe
- Mute
- Subscribe to RSS Feed
- Permalink
- Report Inappropriate Content
What is the role of ValueList()? Can you replace ValueList with an Island Table dimension which is created in the script?
- Mark as New
- Bookmark
- Subscribe
- Mute
- Subscribe to RSS Feed
- Permalink
- Report Inappropriate Content
I am using the ValueList since it gives me the possibility to color trend lines in a line graph.
The following discussion gave me the idea to use Synthetic Dimensions for this purpose: Colored conditional line-charts in dimensions with high number of categories.
I am not familiar with Island Table dimensions so I don't know if that is an alternative.
- Mark as New
- Bookmark
- Subscribe
- Mute
- Subscribe to RSS Feed
- Permalink
- Report Inappropriate Content
I think it should work the same way
- Mark as New
- Bookmark
- Subscribe
- Mute
- Subscribe to RSS Feed
- Permalink
- Report Inappropriate Content
Dear Sunny,
Thanks for your replies!
I think the examples from the discussion I have mentioned are working correctly since they aren't using
"RangeSum(above(total Sum([Monthly budget]),0,RowNo(total))"
in their measure calculation.
In my case it seems that the use of 'total' makes it to sum over the both dimensions: first over the Fiscal Month dimension and a second time over the ValueList dimension.
Does that make sense?
And if it does, can it changed to only sum only once?
By the way: the source data is shown to the right of the line charts on the screenshot.
- Mark as New
- Bookmark
- Subscribe
- Mute
- Subscribe to RSS Feed
- Permalink
- Report Inappropriate Content
You can try this without total... but the order of dimensions matter... so if this doesn't work.. then you will have to use island field with Aggr() function in your expression
RangeSum(above(Sum([Monthly budget]), 0, RowNo())
- Mark as New
- Bookmark
- Subscribe
- Mute
- Subscribe to RSS Feed
- Permalink
- Report Inappropriate Content
Dear Sunny,
Thank you for the feedback.
I will have to try out the Island field with Aggr() function since the expression without total gives the monthly value, not the accumulated value.
If you have any suggestions for study material for the Island field with Aggr() function, I am very interested.
- Mark as New
- Bookmark
- Subscribe
- Mute
- Subscribe to RSS Feed
- Permalink
- Report Inappropriate Content
I will see if I can find any example... but if you are able to provide some mocked up data (dummy) I can show how it can be done with your data....
- « Previous Replies
-
- 1
- 2
- Next Replies »