Unlock a world of possibilities! Login now and discover the exclusive benefits awaiting you.
- Qlik Community
- :
- Forums
- :
- Analytics & AI
- :
- Products & Topics
- :
- App Development
- :
- How to create a bar chart with x axis showing prod...
- Subscribe to RSS Feed
- Mark Topic as New
- Mark Topic as Read
- Float this Topic for Current User
- Bookmark
- Subscribe
- Mute
- Printer Friendly Page
- Mark as New
- Bookmark
- Subscribe
- Mute
- Subscribe to RSS Feed
- Permalink
- Report Inappropriate Content
How to create a bar chart with x axis showing product name for some bars and ranking for others
Hi!
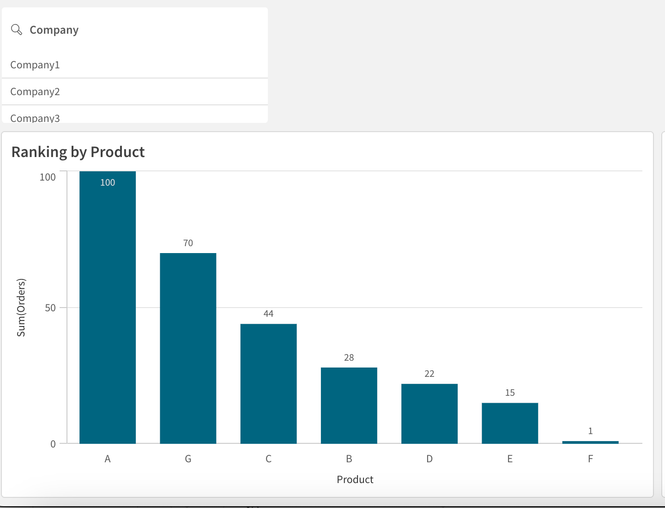
I have a bar chart with a ranking of products by #orders
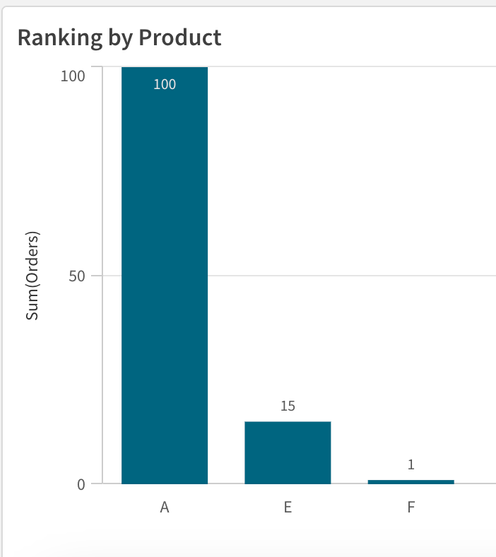
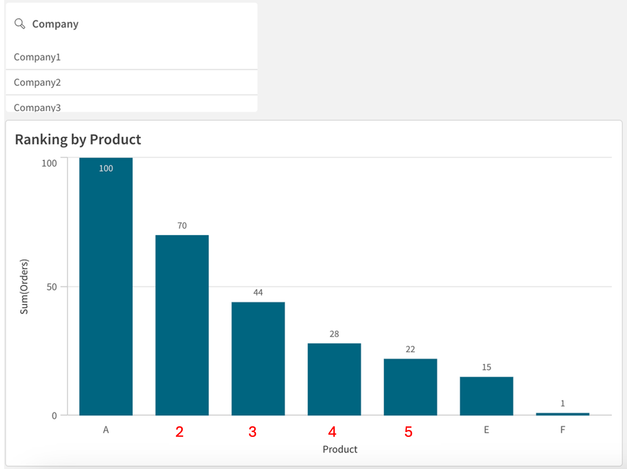
My customer wants that, when he selects a Company, the products related to that Company keep the product name on the X axis, but products from other companies change from product name to the product position in the overall ranking.
For example: If I select Company1, the chart is displayed in this way:
But my customer wants a chart similar to the one sketched below:
The real case is a bit more complex, but I'm facing some problems trying to get this behavior without generating dimensions using scripting. I'd prefer using a dynamic dimension in the chart (number of records is not an issue)
Environment is Qlik Sense Cloud. I'm attaching a sample qvf.
Any suggestion?
Thanks in advance!
Kind regards,
Cecilia.


