Unlock a world of possibilities! Login now and discover the exclusive benefits awaiting you.
- Qlik Community
- :
- Forums
- :
- Analytics & AI
- :
- Products & Topics
- :
- App Development
- :
- How to filter a line graph with lines of different...
- Subscribe to RSS Feed
- Mark Topic as New
- Mark Topic as Read
- Float this Topic for Current User
- Bookmark
- Subscribe
- Mute
- Printer Friendly Page
- Mark as New
- Bookmark
- Subscribe
- Mute
- Subscribe to RSS Feed
- Permalink
- Report Inappropriate Content
How to filter a line graph with lines of different data granularity?
Dear all,
How can I filter the red line with high granularity without loosing (part of) the blue line with data of low granularity?
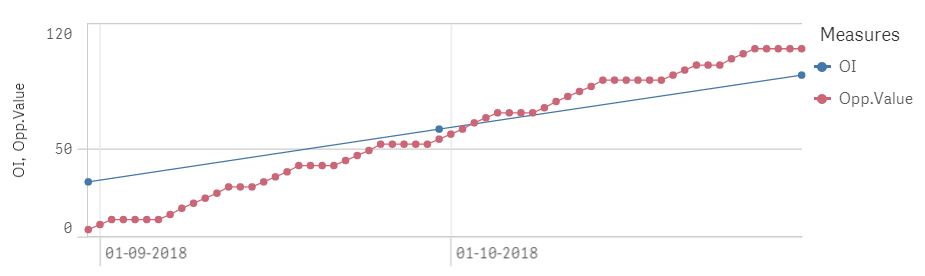
When I filter the red line on basis of an associated field then the middle and right data points of the blue line are lost. Only the left data point remains.
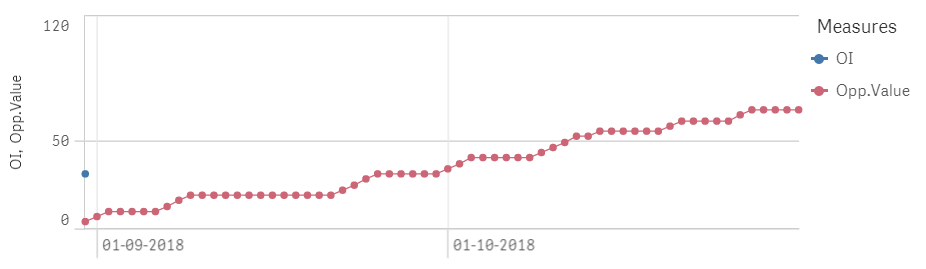
The blue data points disappear since there isn't any red line data (with the filtered value of the associated field) on the dates that the blue line data is available.
I have used a SET condition that should screen off the blue line from selections of the associated field (Opp_Prob) of the red line:
Sum({<Opp_Prob=>}OI) but appearently it doesn't work.
See the attached app and data source excel file.
- Mark as New
- Bookmark
- Subscribe
- Mute
- Subscribe to RSS Feed
- Permalink
- Report Inappropriate Content
OI = Rangesum(above(Sum({<Opp_Prob=>}OI),0,RowNo()))/Min({<Opp_Prob>}Display)
- Mark as New
- Bookmark
- Subscribe
- Mute
- Subscribe to RSS Feed
- Permalink
- Report Inappropriate Content
Dear Aar Kay,
Of course!
Your are completely right. I overlooked this.
Thank you very much for your support.
Best regards,
Pim