- Mark as New
- Bookmark
- Subscribe
- Mute
- Subscribe to RSS Feed
- Permalink
- Report Inappropriate Content
How to get KPI of average calls per person per month
Hello,
I am trying to make a KPI object that shows average number of calls per person per month. I currently have the following script but can not get the per month part of the calculation. Any assistance is appreciated.
Count({$<[Liason Type]={'MSL'},[Product: Description]={'Apples'}>} DISTINCT [Call: Call ID])/count [Datetime.autoCalendar.Month]
- Tags:
- qlik sense
- Mark as New
- Bookmark
- Subscribe
- Mute
- Subscribe to RSS Feed
- Permalink
- Report Inappropriate Content
This script looks like it has worked. I was able to substitute in the actual data and am getting a valid number. It would be great to be able to fix the script so I did not have to add each month every time but maybe that is not an option?
- Mark as New
- Bookmark
- Subscribe
- Mute
- Subscribe to RSS Feed
- Permalink
- Report Inappropriate Content
And how did you do the monthly calculation by hand?
- Mark as New
- Bookmark
- Subscribe
- Mute
- Subscribe to RSS Feed
- Permalink
- Report Inappropriate Content
I guess it might be helpful to know how you calculate average:
- Mark as New
- Bookmark
- Subscribe
- Mute
- Subscribe to RSS Feed
- Permalink
- Report Inappropriate Content
I use excel and a pivot chart. This gives me the total interactions by MSL per month. I then add these numbers together to get a total and then divide this total by the number of months included.
- Mark as New
- Bookmark
- Subscribe
- Mute
- Subscribe to RSS Feed
- Permalink
- Report Inappropriate Content
Based on this article, I calculate the average both ways. For the current KPI I want the year to date average so I this way listed in the article makes sense: Avg( Aggr( Sum(Amount), MonthID ) )
However, there are times when I just want the average number for one month. This would need to be a different KPI or visualization and not what I need for this particular problem.
- Mark as New
- Bookmark
- Subscribe
- Mute
- Subscribe to RSS Feed
- Permalink
- Report Inappropriate Content
Ryan McClellan wrote:
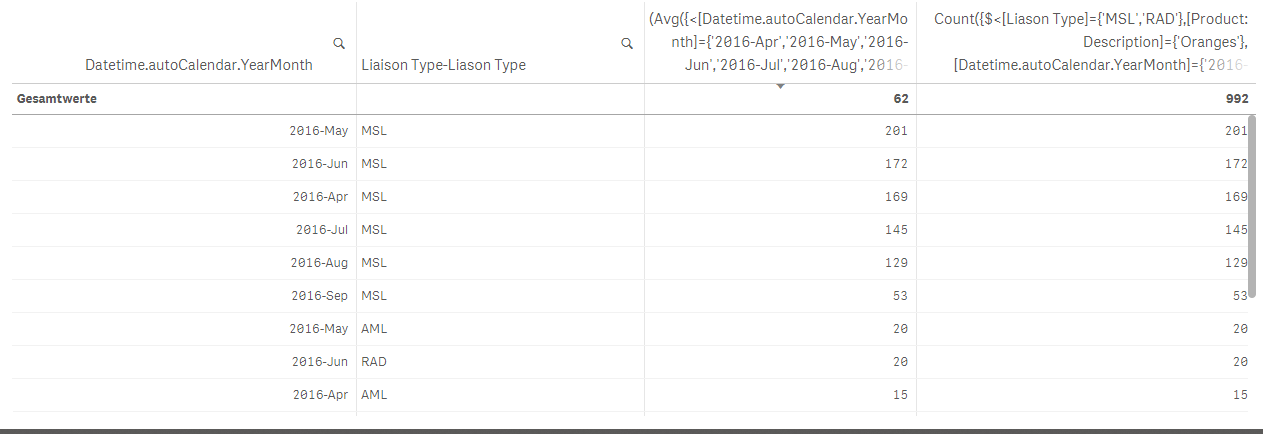
I use excel and a pivot chart. This gives me the total interactions by MSL per month. I then add these numbers together to get a total and then divide this total by the number of months included.
I think that's what my table shows (using your inner aggregation Count() )
- Mark as New
- Bookmark
- Subscribe
- Mute
- Subscribe to RSS Feed
- Permalink
- Report Inappropriate Content
I found something interesting with this script... If I remove the other months and just keep Aug. I only get a total count of interactions for Aug rather than the average for Aug. The total count is correct but strange it does not give the average.
This makes me wonder if the script is working correctly...
- Mark as New
- Bookmark
- Subscribe
- Mute
- Subscribe to RSS Feed
- Permalink
- Report Inappropriate Content
I think I am lost with regard to what you are trying to explain.
Maybe another day...
Guess Sunny is already preparing a demo QVF 
- Mark as New
- Bookmark
- Subscribe
- Mute
- Subscribe to RSS Feed
- Permalink
- Report Inappropriate Content
I was hoping you will handle this Stefan. I am not sure what is needed and how can it be calculated 
UPDATE: Don't give you on Ryan now 
- Mark as New
- Bookmark
- Subscribe
- Mute
- Subscribe to RSS Feed
- Permalink
- Report Inappropriate Content
I appreciate all the help. Let me know what I need to clarify to help.
I will try again with what I need. I need to know the monthly average of interactions per liaison for a product based on 'Liaison Type.' I would like to be able to show this on a per month basis.
I then would like a year to date monthly average of interactions per liaison for a product.
I can have separate KPIs per product and per liaison type.
Hopefully this helps?