Unlock a world of possibilities! Login now and discover the exclusive benefits awaiting you.
- Qlik Community
- :
- Forums
- :
- Analytics
- :
- Topics
- :
- App Development
- :
- Re: How to get chart in Qlik Sense to default to s...
Options
- Subscribe to RSS Feed
- Mark Topic as New
- Mark Topic as Read
- Float this Topic for Current User
- Bookmark
- Subscribe
- Mute
- Printer Friendly Page
Turn on suggestions
Auto-suggest helps you quickly narrow down your search results by suggesting possible matches as you type.
Showing results for
Contributor III
2016-01-19
11:45 PM
- Mark as New
- Bookmark
- Subscribe
- Mute
- Subscribe to RSS Feed
- Permalink
- Report Inappropriate Content
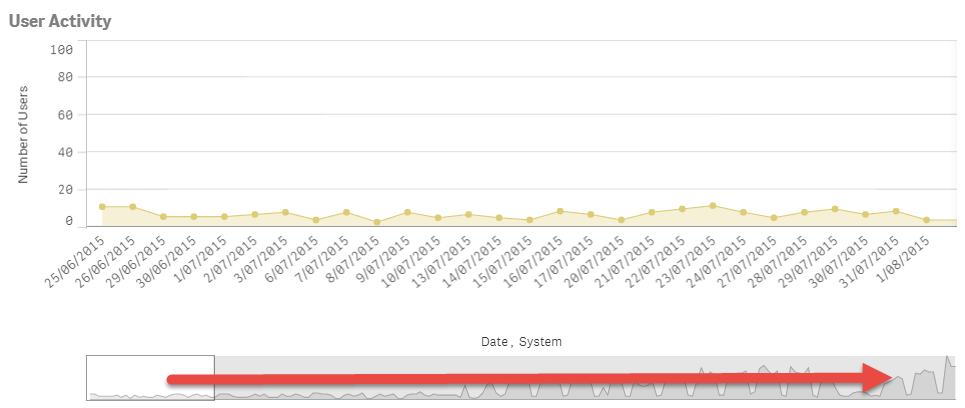
How to get chart in Qlik Sense to default to showing latest values?
How can I get a chart in Qlik Sense to always scrolled to display with the most recent results (far right) showing rather than the oldest?
Only way I can find is to change the sort order of the axis to descending but as it is a date this makes the chart not intuitive to read - most people expect dates to be displayed right to left.
- Tags:
- sense
- time chart
509 Views
1 Reply
Not applicable
2016-04-08
06:40 AM
- Mark as New
- Bookmark
- Subscribe
- Mute
- Subscribe to RSS Feed
- Permalink
- Report Inappropriate Content
Simon did you resolve this as I am hitting the same problem when displaying SPC data
412 Views
Community Browser