Unlock a world of possibilities! Login now and discover the exclusive benefits awaiting you.
- Qlik Community
- :
- Forums
- :
- Analytics & AI
- :
- Products & Topics
- :
- App Development
- :
- Re: How to make this Line Chart in Qlik Sense??
- Subscribe to RSS Feed
- Mark Topic as New
- Mark Topic as Read
- Float this Topic for Current User
- Bookmark
- Subscribe
- Mute
- Printer Friendly Page
- Mark as New
- Bookmark
- Subscribe
- Mute
- Subscribe to RSS Feed
- Permalink
- Report Inappropriate Content
How to make this Line Chart in Qlik Sense??
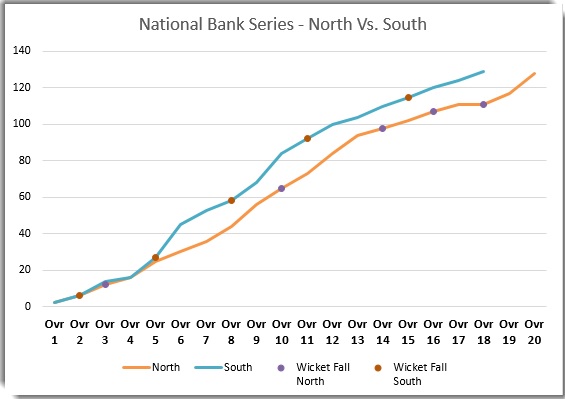
How to make this line chart in Qlik Sense?? I have Runs, Over and Wicket for both of the teams...
- Mark as New
- Bookmark
- Subscribe
- Mute
- Subscribe to RSS Feed
- Permalink
- Report Inappropriate Content
Hi,
What I can see if you need to create a Combo Chart, where you have Run as Dimension and 4 different Expression each one for North, South , Wicket North Fall, Wicket South Fall.
Out of which North and South will be a Line chart and Other two as Symbols.
Regards,
Kaushik Solanki
- Mark as New
- Bookmark
- Subscribe
- Mute
- Subscribe to RSS Feed
- Permalink
- Report Inappropriate Content
You can use Run, North & South as Dimensions or add South & North as Alternate Dimension and then Wicket fall north & Wicket fall south as measures or alternate measures.
This way you'll have line graph with points on it.
See Image.
- Mark as New
- Bookmark
- Subscribe
- Mute
- Subscribe to RSS Feed
- Permalink
- Report Inappropriate Content
Would you be able to provide a sample so that we might be able to play around with it?
- Mark as New
- Bookmark
- Subscribe
- Mute
- Subscribe to RSS Feed
- Permalink
- Report Inappropriate Content
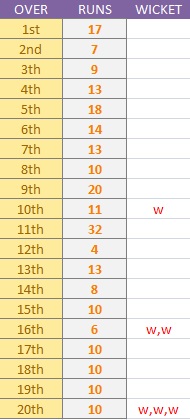
North Team Bowling
South Team Bowling
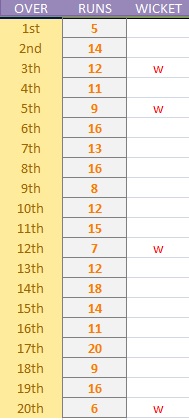
It is a Sample Data... I want this to visualize like above mentioned chart...
- Mark as New
- Bookmark
- Subscribe
- Mute
- Subscribe to RSS Feed
- Permalink
- Report Inappropriate Content
Which Chart or Extension i will use to execute this???
- Mark as New
- Bookmark
- Subscribe
- Mute
- Subscribe to RSS Feed
- Permalink
- Report Inappropriate Content
I cant understand what u want to say... Can u please attach the Script for better understand.??
- Mark as New
- Bookmark
- Subscribe
- Mute
- Subscribe to RSS Feed
- Permalink
- Report Inappropriate Content
Line Chart (default chart in Qlik Sense). Adding Alternate dimensions means it will work as a Cyclic group. Upload the xls file for your sample data and will try to build your requirement.
- Mark as New
- Bookmark
- Subscribe
- Mute
- Subscribe to RSS Feed
- Permalink
- Report Inappropriate Content
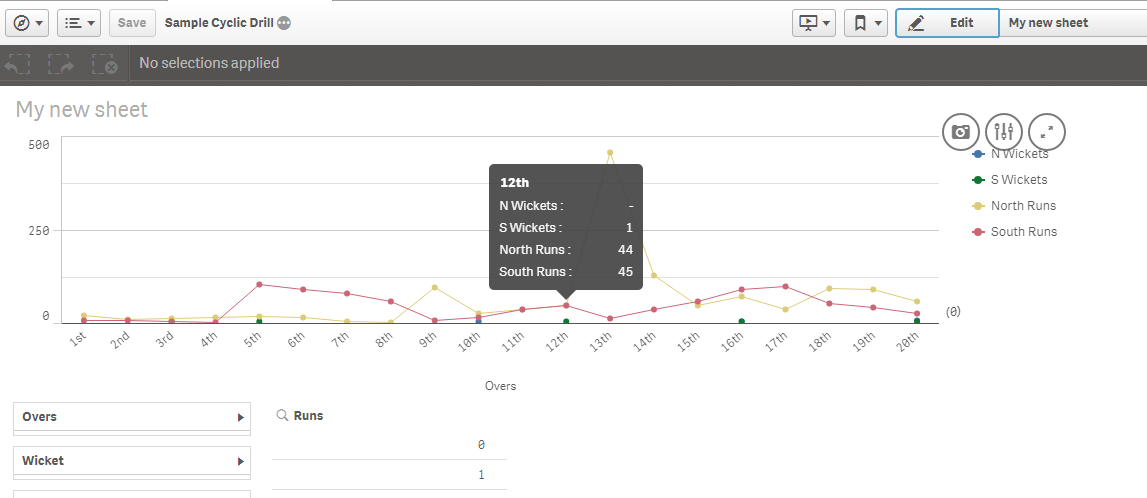
Hello Souvik,
Please find the attachment. I've created a dummy data and maybe this is what you need?
FYI, you need to change Wickets, 'W' to numeric data like for W wicket use 1 and for W,W use 2 wickets and so on....
I used Line Chart to represent that data. I'm not sure if that is what you're looking for.
Thanks.