Unlock a world of possibilities! Login now and discover the exclusive benefits awaiting you.
- Qlik Community
- :
- Forums
- :
- Analytics & AI
- :
- Products & Topics
- :
- App Development
- :
- How to plot line chart stop at current month ?
- Subscribe to RSS Feed
- Mark Topic as New
- Mark Topic as Read
- Float this Topic for Current User
- Bookmark
- Subscribe
- Mute
- Printer Friendly Page
- Mark as New
- Bookmark
- Subscribe
- Mute
- Subscribe to RSS Feed
- Permalink
- Report Inappropriate Content
How to plot line chart stop at current month ?
Hi All
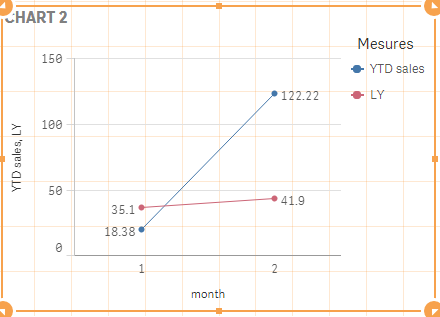
I have a line chart 1 , it can plot the line from jan till Feb . as march no data , so the line stop there.
Because i set the add-on , and i don't tick the show missing value. So it does not display the rest of the month.
In chart 2 i add last year sales line. it is possible to force it also display till Feb ? even it have value in march last year.
I can achieve this in QV , but no in QS.
Paul
Accepted Solutions
- Mark as New
- Bookmark
- Subscribe
- Mute
- Subscribe to RSS Feed
- Permalink
- Report Inappropriate Content
Hi Paul
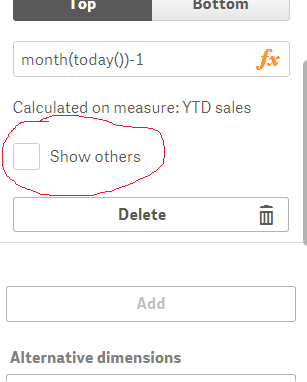
may be just add a limitation in your month dimension :
month(today())-1
it's force your chart to display only previous month :

regards
- Mark as New
- Bookmark
- Subscribe
- Mute
- Subscribe to RSS Feed
- Permalink
- Report Inappropriate Content
Hi Paul
may be just add a limitation in your month dimension :
month(today())-1
it's force your chart to display only previous month :
regards
- Mark as New
- Bookmark
- Subscribe
- Mute
- Subscribe to RSS Feed
- Permalink
- Report Inappropriate Content
Hi Bruno
I look at the chart , it is what i am look for. thank you very much.
I try to do what you said , but i get Other on X Axis and Jan sales. Not sure where i go wrong. it is possible to send me QVF file ? So i can figure out where i go wrong.
Paul
- Mark as New
- Bookmark
- Subscribe
- Mute
- Subscribe to RSS Feed
- Permalink
- Report Inappropriate Content
see attached
hope it helps
bruno
- Mark as New
- Bookmark
- Subscribe
- Mute
- Subscribe to RSS Feed
- Permalink
- Report Inappropriate Content
Hi sir
After i tick show other off , it work fine.
- Mark as New
- Bookmark
- Subscribe
- Mute
- Subscribe to RSS Feed
- Permalink
- Report Inappropriate Content
Does this work for running month too?