Unlock a world of possibilities! Login now and discover the exclusive benefits awaiting you.
Announcements
Talend Cloud AWS EU Scheduled Outage: Starting Tues 26 May 21:00 CEST with expected completion Wed 27 May 01:00 CEST
- Qlik Community
- :
- Forums
- :
- Analytics & AI
- :
- Products & Topics
- :
- App Development
- :
- Re: How to show top 2 Ytd wise.. with 2 dimension....
Options
- Subscribe to RSS Feed
- Mark Topic as New
- Mark Topic as Read
- Float this Topic for Current User
- Bookmark
- Subscribe
- Mute
- Printer Friendly Page
Turn on suggestions
Auto-suggest helps you quickly narrow down your search results by suggesting possible matches as you type.
Showing results for
Partner - Specialist
2017-05-02
06:45 AM
- Mark as New
- Bookmark
- Subscribe
- Mute
- Subscribe to RSS Feed
- Permalink
- Report Inappropriate Content
How to show top 2 Ytd wise.. with 2 dimension..
Hi, I want to show top 4 in line chart.. where my dimension is Month & Competitor.. YTD, QTD wise on selection.
For e.g :
| Month | Name | Value |
| Apr | A | 100 |
| May | A | 200 |
| Jun | A | 102 |
| Jul | A | 120 |
| Aug | A | 140 |
| Sep | A | 130 |
| Oct | A | 80 |
| Apr | B | 150 |
| May | B | 300 |
| Jun | B | 105 |
| Jul | B | 120 |
| Aug | B | 150 |
| Sep | B | 230 |
| Oct | B | 180 |
| Apr | C | 200 |
| May | C | 400 |
| Jun | C | 360 |
| Jul | C | 120 |
| Aug | C | 520 |
| Sep | C | 230 |
| Oct | C | 165 |
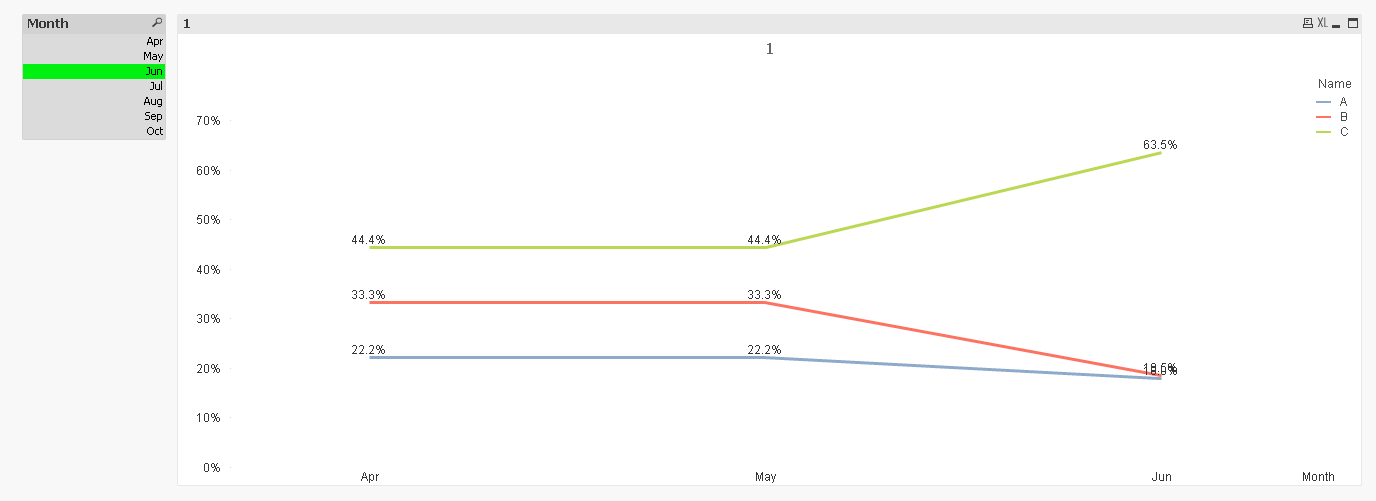
Line Chart has two dimension Month & Name.
Expresssion is : Sum (Value ) / Sum (total Value)
For A will be : 100/450 as the % in the chart..and same for others.
Now I want YTD i.e if I select Jun then it should give for A
Sum of value for A 402 and total value is 1917...
On the basis of YTD, QTD i want top 2...
722 Views
3 Replies
MVP
2017-05-02
06:58 AM
- Mark as New
- Bookmark
- Subscribe
- Mute
- Subscribe to RSS Feed
- Permalink
- Report Inappropriate Content
Are you looking for top 2 or top 4?
Also, assuming you are looking for top 2, are you looking for top 2 names?
680 Views
Partner - Specialist
2017-05-02
07:30 AM
Author
- Mark as New
- Bookmark
- Subscribe
- Mute
- Subscribe to RSS Feed
- Permalink
- Report Inappropriate Content
Top 2 names..
680 Views
MVP
2017-05-02
02:20 PM
- Mark as New
- Bookmark
- Subscribe
- Mute
- Subscribe to RSS Feed
- Permalink
- Report Inappropriate Content
I am still not sure what you are looking to get, but may be this
680 Views