Unlock a world of possibilities! Login now and discover the exclusive benefits awaiting you.
- Qlik Community
- :
- Forums
- :
- Analytics & AI
- :
- Products & Topics
- :
- App Development
- :
- Re: I need help with Dynamic Sorting of dates in m...
- Subscribe to RSS Feed
- Mark Topic as New
- Mark Topic as Read
- Float this Topic for Current User
- Bookmark
- Subscribe
- Mute
- Printer Friendly Page
- Mark as New
- Bookmark
- Subscribe
- Mute
- Subscribe to RSS Feed
- Permalink
- Report Inappropriate Content
I need help with Dynamic Sorting of dates in my equation
I was able to get instructions on how to modify colors per group from this lovely link here:
https://community.qlik.com/docs/DOC-8492
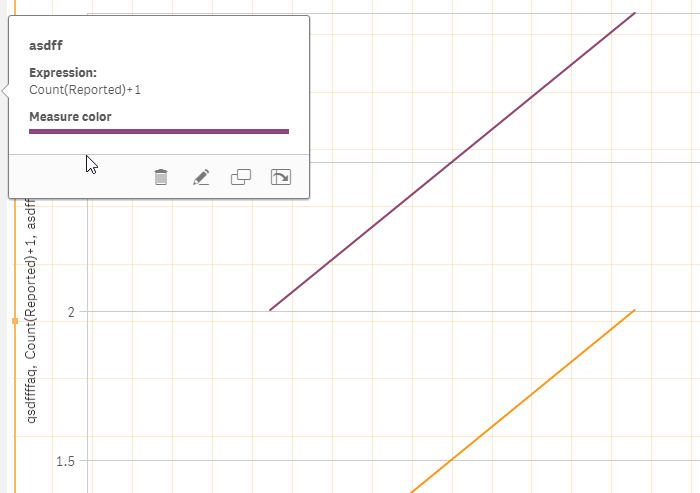
I have created a Line graph using the link above and was able to successfully change the colors or each of my synthetic values.
The problem is when I select certain dates, I don't want to graph to change. I want the graph to show the entire date range.
I have put {1} into my equations, but I still can't get the graph to stay put.
I have used the same equation with a normal graph (i.e. not changing the colors) and had no problems with the time line not changing.
Is this just something that can't be helped due to the nature of the equations, or is there a work around for this?
My current equation is something like this:
=If(
ValueList('Company1','Company2','Company3')='Company1',
(sum(
{1<[Agent]={'*McDonalds*','*Burgerking*','*Wendys*'},
[Sales Person]={'Station Account','Branch Office','*UNKNOWN*'}
>}
[GP (LC)])
-SUM(
{1<[Principal]={'*Burgerking*'},
[Sales Person]={'Station Account','Branch Office','*UNKNOWN*'},
[Agent]={'*McDonalds*'}
>}
[GP (LC)])),
If(
ValueList('Company1','Company2','Company3')='Company 2',
(sum(
{1<[Agent]=-{'*MacDonalds*','*Burgerking*','*Wendys*'},
[Sales Person]={'Station Account','Branch Office','*UNKNOWN*'}
>}
[GP (LC)])
+SUM(
{1<[Principal]={'*Burgerking*'},
[Sales Person]={'Station Account','Branch Office','*UNKNOWN*'},
[Agent]={'*McDonalds*'}
>}
[GP (LC)])),
if(
ValueList('Company1','Company2','Company3')='Company3',
(sum(
{1<[Agent]={'*'},
[Sales Person]=-{'Station Account','Branch Office','*UNKNOWN*'}
>}
[GP (LC)])),
)))
Hope that someone can help me figure this one out.
Best,
Matt
- Mark as New
- Bookmark
- Subscribe
- Mute
- Subscribe to RSS Feed
- Permalink
- Report Inappropriate Content
Hi Matthew,
I think this method is obsolete now.
Have you tried the master item's color yet?

G.
- Mark as New
- Bookmark
- Subscribe
- Mute
- Subscribe to RSS Feed
- Permalink
- Report Inappropriate Content
sorry, I post it at wrong thread ![]()
- Mark as New
- Bookmark
- Subscribe
- Mute
- Subscribe to RSS Feed
- Permalink
- Report Inappropriate Content
Would you be able to share your qvf to show the issue? Alternatively, use Island Table dimension instead of ValueList to do this?
- Mark as New
- Bookmark
- Subscribe
- Mute
- Subscribe to RSS Feed
- Permalink
- Report Inappropriate Content
Hi Gabor and Sunny,
Thanks for the suggestions.
I do not have access to master data or qvf. I am only working from Qlik Sense Cloud. I am just the guy at the bottom who has to make things work.
I figured that having access to the master color items would make things a lot easier.
That being said, is there a way I can add a {1} type expression/statement to stop the dates from changing when selected?
Thanks again
Best,
Matt