Unlock a world of possibilities! Login now and discover the exclusive benefits awaiting you.
- Qlik Community
- :
- Forums
- :
- Analytics & AI
- :
- Products & Topics
- :
- App Development
- :
- Kaplan Meier Estimator with a second dimension
- Subscribe to RSS Feed
- Mark Topic as New
- Mark Topic as Read
- Float this Topic for Current User
- Bookmark
- Subscribe
- Mute
- Printer Friendly Page
- Mark as New
- Bookmark
- Subscribe
- Mute
- Subscribe to RSS Feed
- Permalink
- Report Inappropriate Content
Kaplan Meier Estimator with a second dimension
Hi everyone,
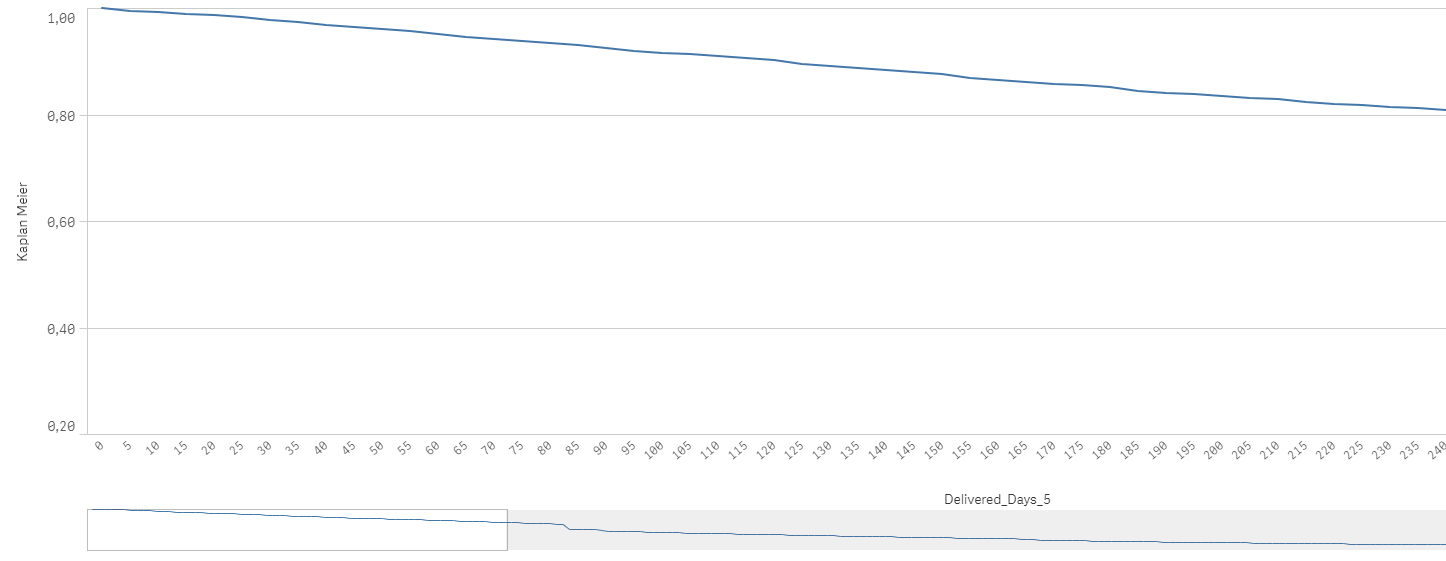
I succeed to implement the Kaplan Meier estimator inside a line chart in Qlik Sense like this
To do that, I write this expression which is the exact transcription of KM Estimator
= if(RowNo() = 1, 1,
  (1 - (count({<Analyse_Type = {'Churn'}>}%Key_Contract) /
  count({<Analyse_Type = {'Parc'}>}%Key_Contract))) * above(Column(1))
)
Everything works fine but I'd like to add a second dimension in the graph and when I do that, the recursive above seems to get muddle up. I try to aggregate the above by my second dimension but it is not working.
Does someone have an idea to do that? Or another way to write the Kaplan Meier estimator without the using of a recursion?
Accepted Solutions
- Mark as New
- Bookmark
- Subscribe
- Mute
- Subscribe to RSS Feed
- Permalink
- Report Inappropriate Content
Hi Peter,
Thanks a lot for your answer.
Good to know about the TOTAL inside sibling functions but I tried your solution and here's what I get:
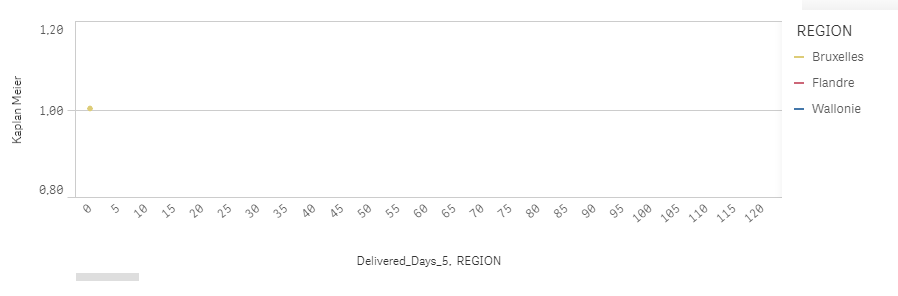
Seems like the above function does not work anymore.
Have you an idea why this does not work?
Edit:
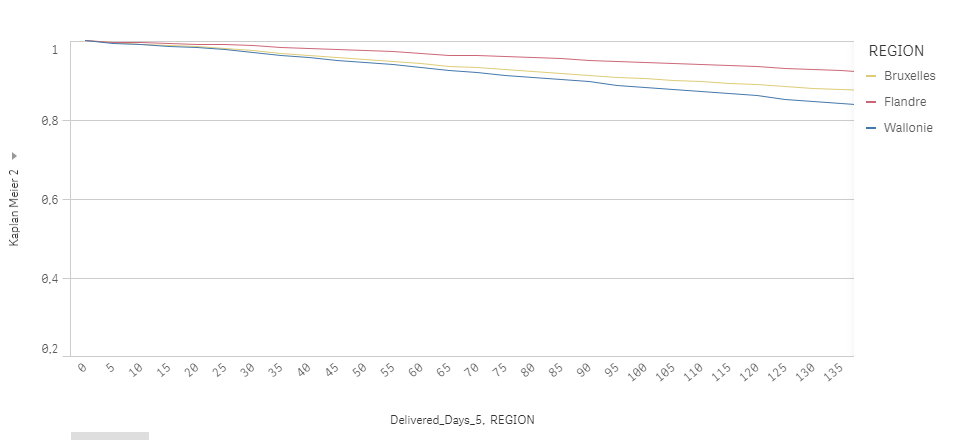
I find a solution to my issue. I switch the way to make a accumulation of product (the recursive above) by the mathematical logic
exp(rangeSum(log())). I aggregate the rangeSum by my second dimension ordered by my first dimension (the interval) and everything works fine.
Here the final expression of the Kaplan Meier Estimator:
exp(aggr(Rangesum(Above(log(fabs(
(1 - (count({<Analyse_Type = {'Churn'}>}%Key_Contract) / count({<Analyse_Type = {'SurvivalParc'}>}%Key_Contract)))) ),0, Rowno()))
, REGION, (Delivered_Days_5, NUMERIC, ASCENDING)))
and here is the visual result:
Thank you for your help.
- Mark as New
- Bookmark
- Subscribe
- Mute
- Subscribe to RSS Feed
- Permalink
- Report Inappropriate Content
When you have more than one dimension you often have to have a TOTAL in the Above() function (or any of it's sibling functions that belong to the inter-record functions). Similarly the RowNo() function also needs a TOTAL ...
So maybe this will work:
if(RowNo(TOTAL) = 1, 1,
  (1 - (count({<Analyse_Type = {'Churn'}>}%Key_Contract) /
  count({<Analyse_Type = {'Parc'}>}%Key_Contract))) * Above(TOTAL Column(1))
)
- Mark as New
- Bookmark
- Subscribe
- Mute
- Subscribe to RSS Feed
- Permalink
- Report Inappropriate Content
Hi Peter,
Thanks a lot for your answer.
Good to know about the TOTAL inside sibling functions but I tried your solution and here's what I get:
Seems like the above function does not work anymore.
Have you an idea why this does not work?
Edit:
I find a solution to my issue. I switch the way to make a accumulation of product (the recursive above) by the mathematical logic
exp(rangeSum(log())). I aggregate the rangeSum by my second dimension ordered by my first dimension (the interval) and everything works fine.
Here the final expression of the Kaplan Meier Estimator:
exp(aggr(Rangesum(Above(log(fabs(
(1 - (count({<Analyse_Type = {'Churn'}>}%Key_Contract) / count({<Analyse_Type = {'SurvivalParc'}>}%Key_Contract)))) ),0, Rowno()))
, REGION, (Delivered_Days_5, NUMERIC, ASCENDING)))
and here is the visual result:
Thank you for your help.