Unlock a world of possibilities! Login now and discover the exclusive benefits awaiting you.
- Qlik Community
- :
- Forums
- :
- Analytics & AI
- :
- Products & Topics
- :
- App Development
- :
- Re: Like For Like Set Analysis
- Subscribe to RSS Feed
- Mark Topic as New
- Mark Topic as Read
- Float this Topic for Current User
- Bookmark
- Subscribe
- Mute
- Printer Friendly Page
- Mark as New
- Bookmark
- Subscribe
- Mute
- Subscribe to RSS Feed
- Permalink
- Report Inappropriate Content
Like For Like Set Analysis
Hi All,
I trying to do some like for like analysis looking at the previous month and last year and I'm stumped on the syntax. The data looks something like this:
| MonthYear | LastMonth | LastYear | sum(Head_Flag) |
|---|---|---|---|
| Sep-2015 | Aug-2015 | Sep-2014 | 2192 |
| Oct-2015 | Sep-2015 | Oct-2014 | 2211 |
| Nov-2015 | Oct-2015 | Nov-2014 | 2207 |
| Dec-2015 | Nov-2015 | Dec-2014 | 2196 |
| Jan-2016 | Dec-2015 | Jan-2015 | 2219 |
| Feb-2016 | Jan-2016 | Feb-2015 | 2224 |
| Mar-2016 | Feb-2016 | Mar-2015 | 2185 |
| Apr-2016 | Mar-2016 | Apr-2015 | 2172 |
| May-2016 | Apr-2016 | May-2015 | 2173 |
| Jun-2016 | May-2016 | Jun-2015 | 2146 |
| Jul-2016 | Jun-2016 | Jul-2015 | 2129 |
| Aug-2016 | Jul-2016 | Aug-2015 | 2109 |
| Sep-2016 | Aug-2016 | Sep-2015 | 2093 |
I'm trying to add three additional columns, Headcount last month, Head count last year and Average headcount between last year and current month.
The current month is provided as a selection criteria ultimately resulting in the straight table containing one row of data.
To get last month and Last Years headcount this syntax seems to work as long as none of the dimensions in the straight table are dates:
Last Month:Sum({<MonthYear = P(Previous_MonthYear)>}Head_Flag)
Last Year:Sum({<MonthYear = P(LastYear)>}Head_Flag)
I'm struggling to find the right syntax to do a between statement in the set analysis that refers to LastYear and MonthYear for the final column.
Any help is much appreciated

- Mark as New
- Bookmark
- Subscribe
- Mute
- Subscribe to RSS Feed
- Permalink
- Report Inappropriate Content
May be try this:
Last Month
Above(Sum(Head_Flag))
Last Year
Above(Sum(Head_Flag), 12)
- Mark as New
- Bookmark
- Subscribe
- Mute
- Subscribe to RSS Feed
- Permalink
- Report Inappropriate Content
Hi Sunny, thanks for the response. I've had a play with the above function and looked at the documentation. It certainly works until I make a selection criteria of a specific month at which point the function returns no results.
Before Selection criteria:
| MonthYear | Sum(Head_Flag) | above(Sum(Head_Flag)) | Above(Sum(Head_Flag), 12) |
| Sep-2015 | 2192 | - | - |
| Oct-2015 | 2211 | 2192 | - |
| Nov-2015 | 2207 | 2211 | - |
| Dec-2015 | 2196 | 2207 | - |
| Jan-2016 | 2219 | 2196 | - |
| Feb-2016 | 2224 | 2219 | - |
| Mar-2016 | 2185 | 2224 | - |
| Apr-2016 | 2172 | 2185 | - |
| May-2016 | 2173 | 2172 | - |
| Jun-2016 | 2146 | 2173 | - |
| Jul-2016 | 2129 | 2146 | - |
| Aug-2016 | 2109 | 2129 | - |
| Sep-2016 | 2093 | 2109 | 2192 |
| Oct-2016 | 2091 | 2093 | 2211 |
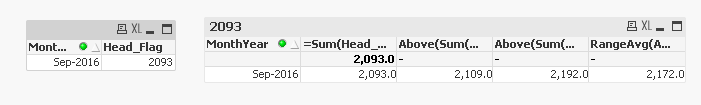
Once selection criteria is set:
| MonthYear | Sum(Head_Flag) | above(Sum(Head_Flag)) | Above(Sum(Head_Flag), 12) |
| Sep-2016 | 2093 | - | - |
I was able to get a cumulative total using RangeAvg(Above(Sum(Head_Flag),0,12)) but again this only works if no selection criteria are made.
Thanks again for the assistance
- Mark as New
- Bookmark
- Subscribe
- Mute
- Subscribe to RSS Feed
- Permalink
- Report Inappropriate Content
Try this:
1 month above
Above(Sum({<MonthYear, Month, Date, Year>}Head_Flag)) * Avg(1)
12 months above
Above(Sum({<MonthYear, Month, Date, Year>}Head_Flag), 12) * Avg(1)
12 month rolling average
RangeAvg(Above(Sum({<MonthYear, Month, Date, Year>}Head_Flag), 0, 12)) * Avg(1)
- Mark as New
- Bookmark
- Subscribe
- Mute
- Subscribe to RSS Feed
- Permalink
- Report Inappropriate Content
Attaching a sample for you to have a look at. I am only ignoring selection in MonthYear field because I don't have other date and time fields, but you need to ignore all date and time related fields where you can possibly make selections and you don't want them to impact the result of your calculation.
- Mark as New
- Bookmark
- Subscribe
- Mute
- Subscribe to RSS Feed
- Permalink
- Report Inappropriate Content
Hi Sunny,
Thanks for all the assistance. I continued reading up on the Above function after your last suggestion and ended up with the following:
Only({<MonthYear=>}Aggr(RangeAvg(Above(Sum({$<MonthYear=>}Head_Flag),0,12)), MonthYear))
Looks pretty similar to your suggestion above. Can I ask what is the *Avg(1) doing in your example above?
I'm also trying to limit the results to the current month (without the user specifying it via a selection criteria. I've settled on this code, but it has some issues if the user does actually use a selection criteria you get all the months up to the maximum from the set analysis:
Only({<MonthYear={">=$(=max(MonthYear))"}>}Aggr(RangeAvg(Above(Sum({$<MonthYear=>}Head_Flag),0,12)), MonthYear))
Thanks Again!
- Mark as New
- Bookmark
- Subscribe
- Mute
- Subscribe to RSS Feed
- Permalink
- Report Inappropriate Content
May be try this:
Only({<MonthYear = {">=$(=Min(MonthYear))<=$(=Max(MonthYear))"}>} Aggr(RangeAvg(Above(Sum({$<MonthYear>} Head_Flag),0,12)), MonthYear))
or this:
Only({<MonthYear = {"$(=Max(MonthYear))"}>} Aggr(RangeAvg(Above(Sum({$<MonthYear>} Head_Flag),0,12)), MonthYear))