Unlock a world of possibilities! Login now and discover the exclusive benefits awaiting you.
- Qlik Community
- :
- Forums
- :
- Analytics & AI
- :
- Products & Topics
- :
- App Development
- :
- Line Chart Axis Ignore Selections
- Subscribe to RSS Feed
- Mark Topic as New
- Mark Topic as Read
- Float this Topic for Current User
- Bookmark
- Subscribe
- Mute
- Printer Friendly Page
- Mark as New
- Bookmark
- Subscribe
- Mute
- Subscribe to RSS Feed
- Permalink
- Report Inappropriate Content
Line Chart Axis Ignore Selections
I'm working on a line chart within one of my apps where I'm trying to compare the daily number of hours worked by our staff on a quarter-over-quarter basis and I'm having trouble getting the X-axis to behave how I want it to. I'm using the DayNumberOfQuarter() function within my calendar generation script and then using that field as the X-axis for my chart (this will always range from 1 to 91 or 92 depending on the quarter). The two chart measures are expressions that sum up the "Hours Worked" field with a Set Analysis modifier tying to each of the two quarters being compared (these are two island fields being selected via Filter Panes).

Measure Expressions:
- Sum({$<[PBJ Quarter]={$(vL.LeftPbjQuarterCompareSelectedQuarter)}>} [Hours Worked])
- Sum({$<[PBJ Quarter]={$(vL.RightPbjQuarterCompareSelectedQuarter)}>} [Hours Worked])
Variables used in Measure Expressions:
- ='''' & Replace(GetFieldSelections([_Left PBJ Quarter Compare], ', ', 200), ', ', '", "') & ''''
- ='''' & Replace(GetFieldSelections([_Right PBJ Quarter Compare], ', ', 200), ', ', '", "') & ''''
The chart is working fine at this high level without making any additional selections however what I really need is to be able to do is select Job Title Codes so we can do comparisons of hours for specific Job Titles and identify variance within each job on a quarterly basis. What's happening is that when I make a selection in the [Job Title Code w/ Description (PBJ)] field the X-axis is adjusting so that only dates where hours were worked by that particular Job Title remain on the chart such as in the image below:

I know this is expected out-of-the-box behavior and as such I've tried to make this behave how I want using Set Analysis on my X-axis dimension ([Internal Files Day Number in Quarter]) and telling it to ignore selections on the [Job Title Code w/ Description (PBJ)] field but no matter what I do the days are still disappearing when making a selection in the Job Title Code w/ Description (PBJ)] field:
Attempted Expressions for X-axis:
- Aggr(Only({$<[Job Title Code w/ Description (PBJ)]=>} [Internal Files Day Number in Quarter]), [Internal Files Day Number in Quarter])
- Aggr(Only({1} [Internal Files Day Number in Quarter]), [Internal Files Day Number in Quarter])
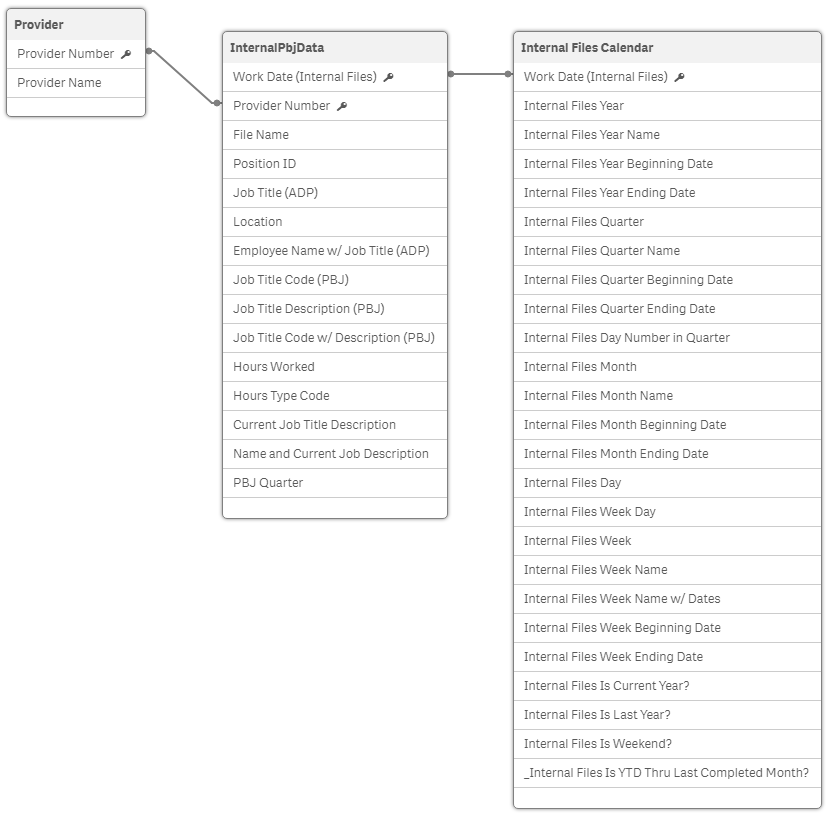
I've gone so far as to pare down my data model to the bare bones minimum thinking perhaps there were other things in play but even at it's simplest level I can't get this working, help!
Data Model:

- Mark as New
- Bookmark
- Subscribe
- Mute
- Subscribe to RSS Feed
- Permalink
- Report Inappropriate Content
reading on my phone so not completly clear on the problem
What i understood Your issue is the days disappearing when a selection is made.
A just my initial thoughts a slightly hacky idea
try adding + sum({1} 0.001) to you expressions