Unlock a world of possibilities! Login now and discover the exclusive benefits awaiting you.

- Qlik Community
- :
- Forums
- :
- Analytics & AI
- :
- Products & Topics
- :
- App Development
- :
- Re: Line Chart Incorrectly Sorting Month (x-axis) ...
- Subscribe to RSS Feed
- Mark Topic as New
- Mark Topic as Read
- Float this Topic for Current User
- Bookmark
- Subscribe
- Mute
- Printer Friendly Page

 boninomolly
- Mark as New
- Bookmark
- Subscribe
- Mute
- Subscribe to RSS Feed
- Permalink
- Report Inappropriate Content
Line Chart Incorrectly Sorting Month (x-axis) to show data with 0% before following the sort express
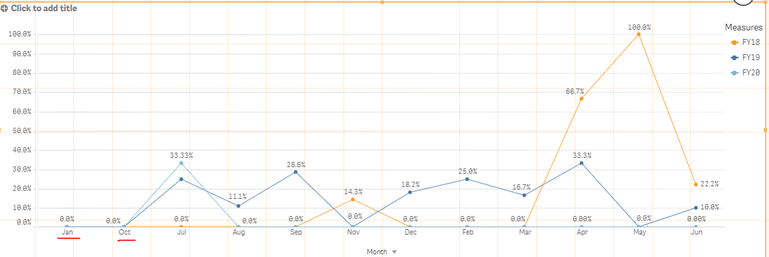
I have a line chart with 3 legends : FY18,FY19, FY20. See below. I have the sort expression as : Match([Month], 'Jul', 'Aug', 'Sep', 'Oct', 'Nov', 'Dec', 'Jan','Feb','Mar', 'Apr', 'May','Jun')
The issue is that when I select a slicer and look at particular cuts, data that is 0% will show up before the model follows the set sort order expression. Below: Jan and October are showing up first.... Any insight? I have tried switching continuous axis to off. No luck with this. Thanks in advance.

 Yoshidaqlik
- Mark as New
- Bookmark
- Subscribe
- Mute
- Subscribe to RSS Feed
- Permalink
- Report Inappropriate Content
Hi,
the expression seems to be correct
try in the script to create a field that is number something like num # (month (date))
Since it has more than one dimension on the X axis, it is perhaps this sort order that is interfering
regards

 anushree1
- Mark as New
- Bookmark
- Subscribe
- Mute
- Subscribe to RSS Feed
- Permalink
- Report Inappropriate Content
A sample application would help in understanding the issue better
