Unlock a world of possibilities! Login now and discover the exclusive benefits awaiting you.
- Qlik Community
- :
- Forums
- :
- Analytics & AI
- :
- Products & Topics
- :
- App Development
- :
- Line Chart for Rolling Time Period
- Subscribe to RSS Feed
- Mark Topic as New
- Mark Topic as Read
- Float this Topic for Current User
- Bookmark
- Subscribe
- Mute
- Printer Friendly Page
- Mark as New
- Bookmark
- Subscribe
- Mute
- Subscribe to RSS Feed
- Permalink
- Report Inappropriate Content
Line Chart for Rolling Time Period
Hi All,
I have a plotted a line chart for the % of 3 types of products A,B and C for the past months in QlikSense:
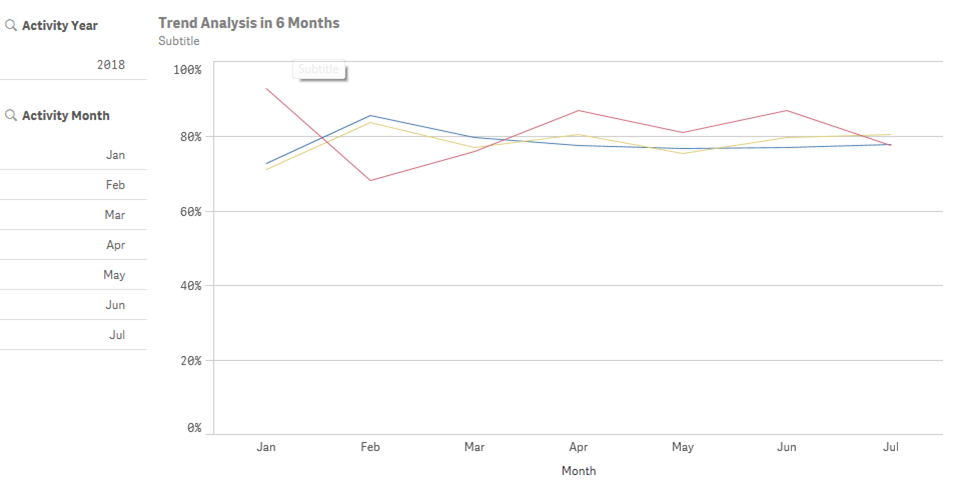
I have few questions when building this chart:
1) Is it possible to show the month in "MMM - YY" format? My original field is a data field and I have used =Month([Activity Date]) as dimension. How can I change the label of my chart? I have tried =Date(Month([Activity Date]),'MMM-YY'), but it is not working...strange values come up. FYI, my activity date is a calculated field by subtracting 1 month from another field that is in date format.
2) As you can see from the title of the chart, it is supposed to be a chart showing rolling past 6 months data only. I want to allow users to choose the activity month from the filter on left hand side. When nothing is selected for the activity month, I would like to show all months as the trend. If a particular month is selected, say 2018 Jun, then I want the chart to show only from 2018 Jan to Jun data. If more than 1 month is selected, say 2018 May & Jun are both selected, I want the chart to show past 6 months counting backward from May (the earliest month in the selection), i.e. 2017 Dec - 2018 May. If possible, I want to change the filter on left hand side to Year Month format as well. Currently I have no idea what should be the right expression to use here.
3) Silly question, is it possible to add a subtitle in QlikSense with 2 lines? E.g.:
Subtitle 1st line
Subtitle 2nd line
I tried chr(13) or chr (10), both not working in QlikSense.
It is okay if you could not answer all of my questions, I would be very appreciated only if you could answer 1/2 of them. Thanks in advance for your time looking into my questions and your help.
- « Previous Replies
-
- 1
- 2
- Next Replies »
- Mark as New
- Bookmark
- Subscribe
- Mute
- Subscribe to RSS Feed
- Permalink
- Report Inappropriate Content
Hi, Janice. On the first point, try this =Date([Activity Date],'MMM-YY')
On the second, you need set analysis like this {< [Activity Date] = {">=$(=MonthStart(AddMonths(Min([Activity Date]),-6) ))<=$(=MonthEnd(Max([Activity Date])))"} >}
About multiline title I don't know))
- Mark as New
- Bookmark
- Subscribe
- Mute
- Subscribe to RSS Feed
- Permalink
- Report Inappropriate Content
points 1 & 2 as per andrey's suggestions.
point 3, use subtitle and/or footnote.
- Mark as New
- Bookmark
- Subscribe
- Mute
- Subscribe to RSS Feed
- Permalink
- Report Inappropriate Content
Hi Andrey,
First of all, thank you so much for looking into my question and spend time to help.
1. I tried putting your expression =Date([Activity Date],'MMM-YY') in my dimension expression, but it results in below chart:
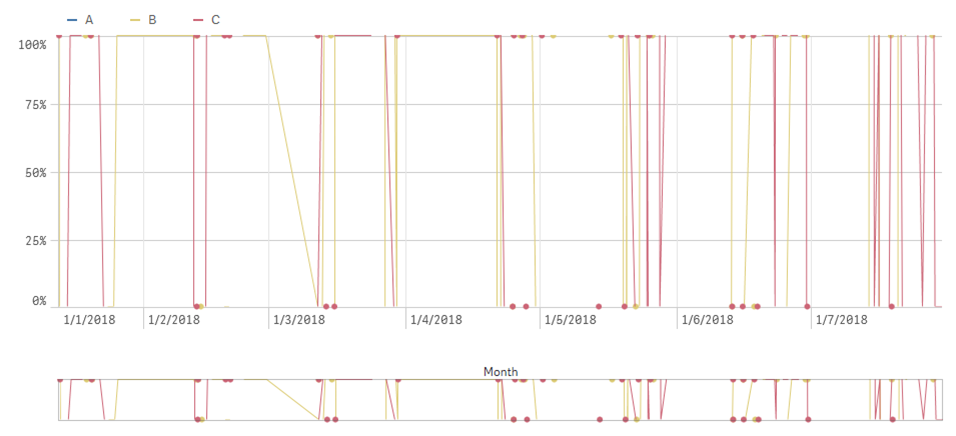
This is not what i want....now, I tried another expression, =Month([Activity Date]) &'-'& Year([Activity Date]) , which can give what I am looking for, I just wonder if there is a smarter way to do so.
2.I tried to add your whole function into my expression, but then the line for product A is gone (the blue line). Because I originally have other conditions added in my count, so I tried to put below expression for measure, trying to get the %:
count({<[Activity Date] = {">=$(=MonthStart(AddMonths(Min([Agent_Survey.Activity Date]),-6) ))<=$(=MonthEnd(Max([Agent_Survey.Activity Date])))"},[Q1]={'Strongly Agree','Agree'},[Type]={'A'}>}[Q1])/ count({<[Activity Date] = {">=$(=MonthStart(AddMonths(Min([Agent_Survey.Activity Date]),-6) ))<=$(=MonthEnd(Max([Agent_Survey.Activity Date])))"},[Type]={'A'}>}[Q1])
After adding the rolling time period expression, the line just disappeared. Any idea what goes wrong??
- Mark as New
- Bookmark
- Subscribe
- Mute
- Subscribe to RSS Feed
- Permalink
- Report Inappropriate Content
Hi, Janice. The problem can be in the date format. [Activity Date] and MonthStart(AddMonths(Min([Agent_Survey.Activity Date]),-6) ) should be the same. Check it and if they are not add date() function
count({<[Activity Date] = {">=$(=Date(MonthStart(AddMonths(Min([Agent_Survey.Activity Date]),-6)), 'ActivityDateFormat'))<=$(=Date(MonthEnd(Max([Agent_Survey.Activity Date])), 'ActivityDateFormat'))"},[Q1]={'Strongly Agree','Agree'},[Type]={'A'}>}[Q1])/ count({<[Activity Date] = {">=$(=Date(MonthStart(AddMonths(Min([Agent_Survey.Activity Date]),-6) ), 'ActivityDateFormat'))<=$(=Date(MonthEnd(Max([Agent_Survey.Activity Date])), 'ActivityDateFormat'))"},[Type]={'A'}>}[Q1])
- Mark as New
- Bookmark
- Subscribe
- Mute
- Subscribe to RSS Feed
- Permalink
- Report Inappropriate Content
I did some research online and finally tried below expression and it works:
[Activity Date]= {"$(='>=' & Date(AddMonths(Max([Activity Date] ), -6), 'DD/MM/YYYY') & '<=' & Date(Max([Activity Date] ), 'DD/MM/YYYY'))"}>}
Thanks for your help though.
- Mark as New
- Bookmark
- Subscribe
- Mute
- Subscribe to RSS Feed
- Permalink
- Report Inappropriate Content
Hi Andrey,
Although I can achieve my objective partially, i.e. showing recent 6 months data (as shown in 1st picture).
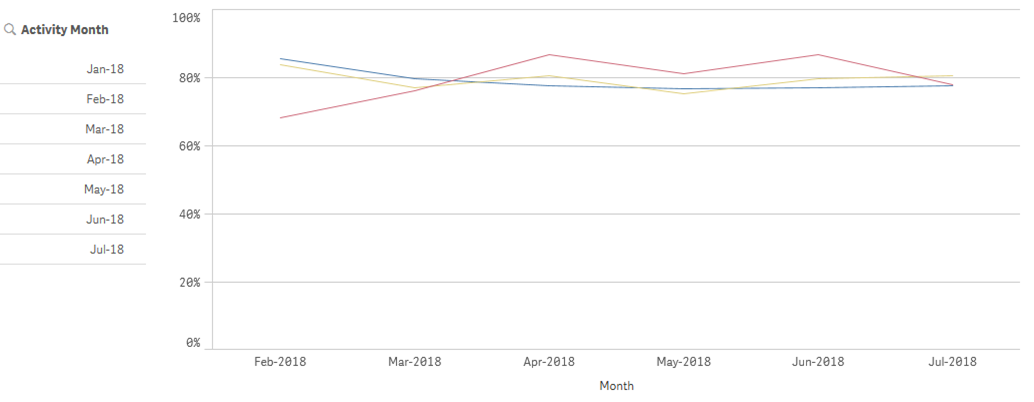
However, when user select particular month from the panel on left hand side, the line chart will only show the data for selected month only (as shown in 2nd picture), instead of the last 6 months from the selected month. (suppose data from Jan to Jun is shown when Jun is selected)....
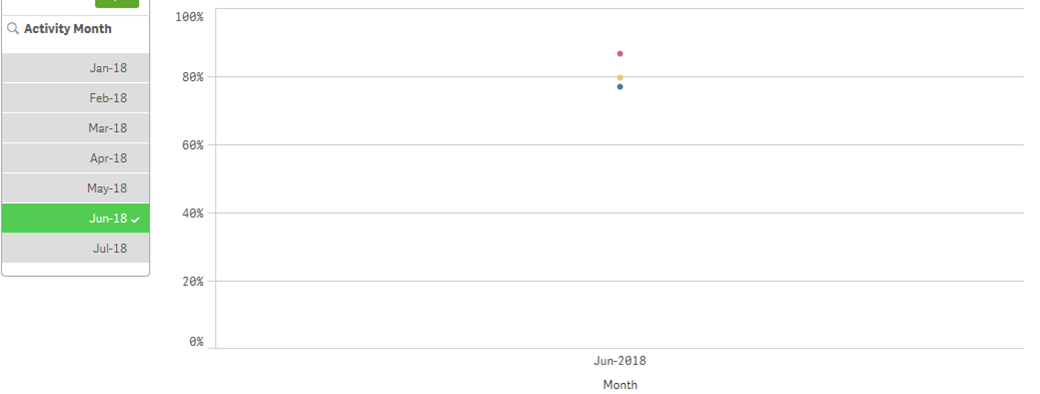
Do you have any idea how to modify the expression to achieve what i want to do? Appreciate if you could help!
- Mark as New
- Bookmark
- Subscribe
- Mute
- Subscribe to RSS Feed
- Permalink
- Report Inappropriate Content
Hi, Janice. Yes, you need to add this field in set analysis as well
count({<[Activity Date] = {">=$(=Date(MonthStart(AddMonths(Min([Agent_Survey.Activity Date]),-6)), 'DD/MM/YYYY'))<=$(=Date(MonthEnd(Max([Agent_Survey.Activity Date])), 'DD/MM/YYYY'))"},[Q1]={'Strongly Agree','Agree'},[Type]={'A'}, [Activity Month] >}[Q1])/ count({<[Activity Date] = {">=$(=Date(MonthStart(AddMonths(Min([Agent_Survey.Activity Date]),-6) ), 'DD/MM/YYYY'))<=$(=Date(MonthEnd(Max([Agent_Survey.Activity Date])), 'DD/MM/YYYY'))"},[Type]={'A'} , [Activity Month] >}[Q1])
- Mark as New
- Bookmark
- Subscribe
- Mute
- Subscribe to RSS Feed
- Permalink
- Report Inappropriate Content
Hi Andrey,
I think I am pretty close to the solution, but i am not sure what to put for [Activity Month] because i don't really have a field named [Activity Month].
The data structure of my sample data is that, i have a data column named [Agent_Survey.Submitted Date] in timestamp format. I calculated the [Agent_Survey.Activity Date] field by using expression of "=addmonths ([Agent_Survey.Submitted Date],-1)". So.....i am not sure what to put in the [Activity Month] you mentioned here......i tried "=month([Agent_Survey.Activity Date])" and Date(MonthStart([Agent_Survey.Activity Date]), 'MMM-YY') , but both failed...
FYI. the expression of the filter panel "Activity Month]" i am using on the left hand side is: Date(MonthStart([Agent_Survey.Activity Date]), 'MMM-YY')
Sorry for keep asking you the same question, hope you could help me a little bit here...
- Mark as New
- Bookmark
- Subscribe
- Mute
- Subscribe to RSS Feed
- Permalink
- Report Inappropriate Content
Well, then put [Agent_Survey.Activity Date] instea of [Activity Month]
count({<[Activity Date] = {">=$(=Date(MonthStart(AddMonths(Min([Agent_Survey.Activity Date]),-6)), 'DD/MM/YYYY'))<=$(=Date(MonthEnd(Max([Agent_Survey.Activity Date])), 'DD/MM/YYYY'))"},[Q1]={'Strongly Agree','Agree'},[Type]={'A'}, [Agent_Survey.Activity Date] >}[Q1])/ count({<[Activity Date] = {">=$(=Date(MonthStart(AddMonths(Min([Agent_Survey.Activity Date]),-6) ), 'DD/MM/YYYY'))<=$(=Date(MonthEnd(Max([Agent_Survey.Activity Date])), 'DD/MM/YYYY'))"},[Type]={'A'} , [Agent_Survey.Activity Date] >}[Q1])
- « Previous Replies
-
- 1
- 2
- Next Replies »